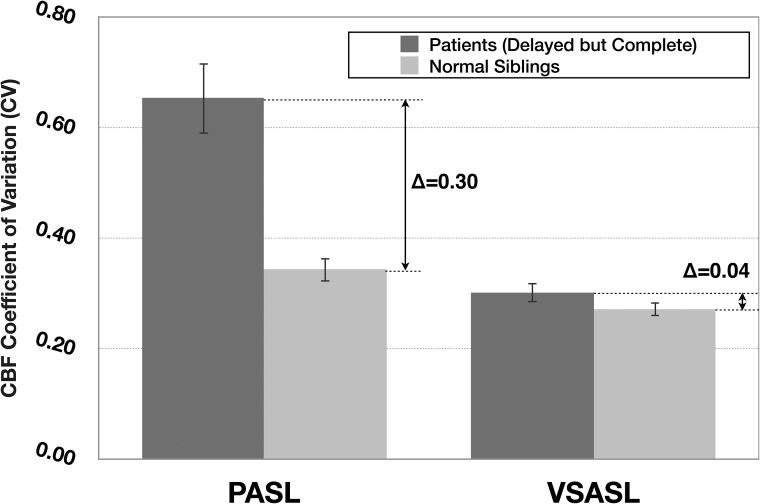
Fig 3.
Average PASL and VSASL-CBF CV (a marker of perfusion variability) calculated for patient vascular territories demonstrating delayed-but-complete parenchymal perfusion by DSA, with normal sibling values provided for comparison. Patient VSASL values are similar to those of healthy siblings, consistent with the DSA appearance, but PASL values are markedly different. Error bars denote 95% CI.

