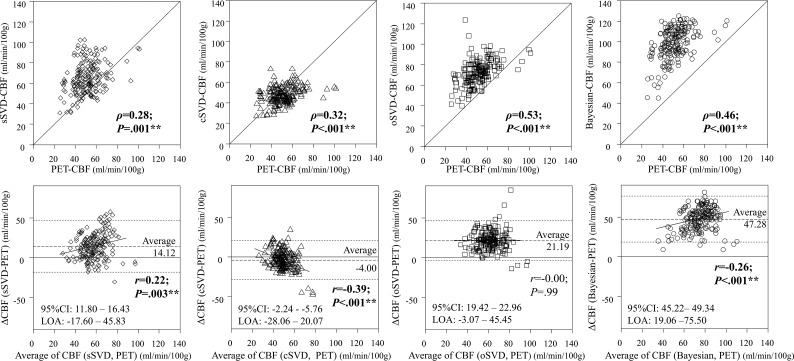
Fig 2.
The Bland-Altmann analysis between the regional raw CBF values of PET and each of the 4 DSC analyses. All methods showed moderate correlation between DSC and PET, and there was no significant difference between Bayesian analysis and the other SVD methods except for sSVD (versus cSVD,P = .11; versus oSVD, P = .37; versus sSVD, P = .04). sSVD overestimates PET-CBF with a small proportional bias; cSVD underestimates PET-CBF with moderate negative proportional bias; oSVD overestimates PET-CBF without proportional bias; and Bayesian-CBF strongly overestimates PET-CBF with a small proportional bias. LOA, limits of agreement defined as average ± 1.96 × SD. *P < .05 and **P < .005.

