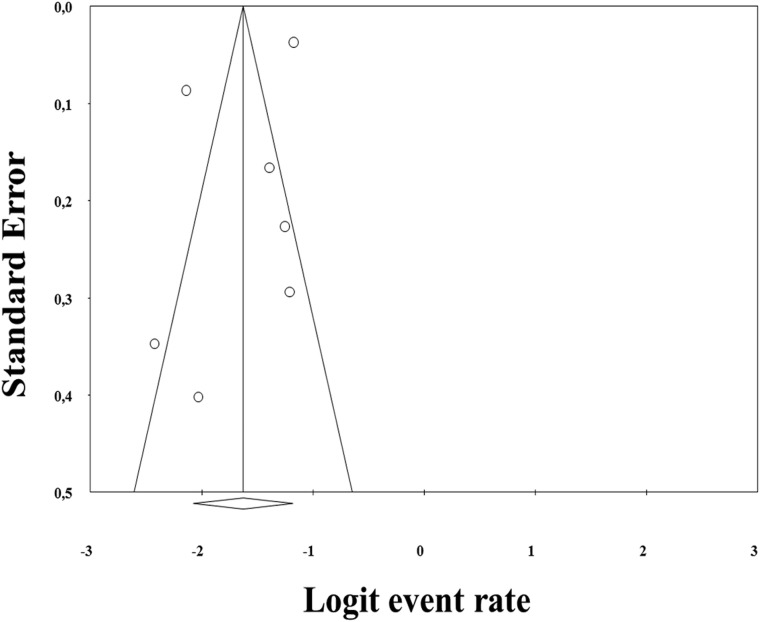
Fig 2.
Funnel plot of incidental findings in brain MR imaging of healthy children. Each dot represents a study; the y-axis represents the size of the study (ie, number of subjects) and the x-axis shows the result of the study (ie, prevalence of incidental findings). Aysmmetric funnel plot suggests no relationship between IF prevalence and study size.

