. 2020 Jan 14;7(2):e662. doi: 10.1212/NXI.0000000000000662
Copyright © 2020 The Author(s). Published by Wolters Kluwer Health, Inc. on behalf of the American Academy of Neurology.
This is an open access article distributed under the terms of the Creative Commons Attribution-NonCommercial-NoDerivatives License 4.0 (CC BY-NC-ND), which permits downloading and sharing the work provided it is properly cited. The work cannot be changed in any way or used commercially without permission from the journal.
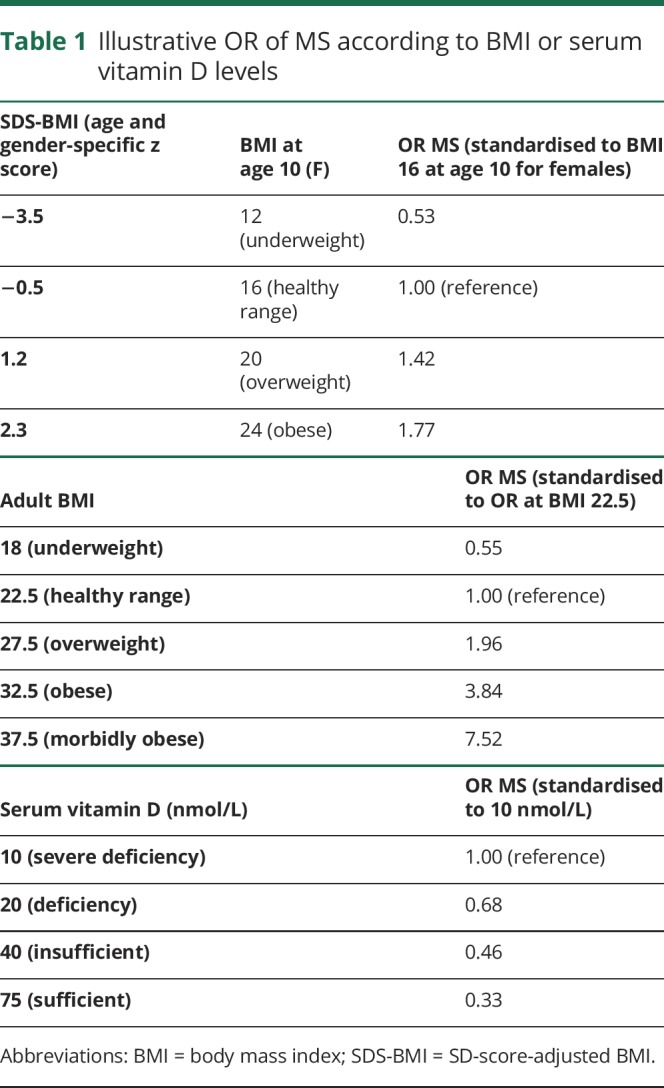
Table 1.
Illustrative OR of MS according to BMI or serum vitamin D levels