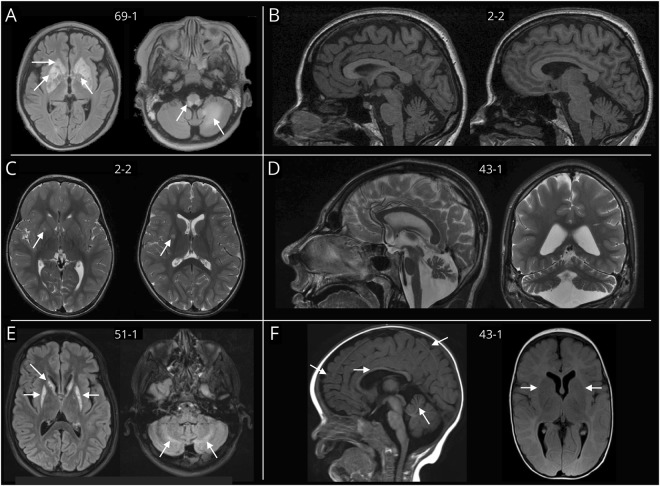
Figure 4. Examples of brain MRI changes detected in patients with MT-ATP6-associated disease.
Number of the patient is given in the middle of the images. (A) FLAIR sequence of axial view showing symmetrical bilateral hyperintensities and partly cystic degeneration in the caudate nuclei and putamen (arrows on the left image), as well as bilateral hyperintensities in the medulla oblongata and hyperintensities on the left cerebellar hemisphere (arrows on the right image). (B) Sagittal view of T1 sequence shows a pronounced fronto-parietal and cerebellar atrophy. (C) Axial view of T2 sequence shows subtle unilateral hyperintensities in the left putamen (arrow on left and right image). (D) T2 sequence of sagittal view reveals a microcephaly and hypoplasia of the brainstem and cerebellum. (E) axial view of FLAIR sequence shows bilateral putaminal and caudate head signal alterations, atrophy and cystic changes (arrows on left image). Axial view of T2 sequence reveals a slight cerebellar atrophy and bilateral T2 hyperintensities within the cerebellar peduncles (right image). (F) T1 sequence of sagittal view shows cerebellar and cerebral atrophy and thinning of the corpus callosum (arrows on the left image), whereas basal ganglia structure appeared normal (arrows on right side). FLAIR = fluid-attenuated inversion recovery.

