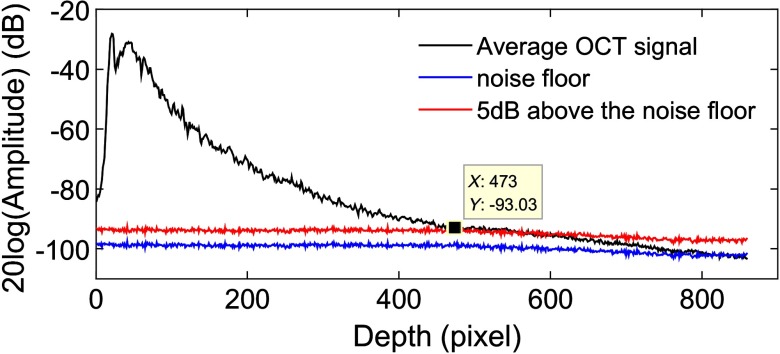
Fig. 1.
OCT signal cropping. The black curve is a typical average OCT signal. The blue curve indicates noise floor measured with the reference light only. The red curve represents the position that is 5 dB above the noise floor. The small black square is where the signal is cropped. All the curves were obtained by averaging 100 consecutive measurements to facilitate comparison.

