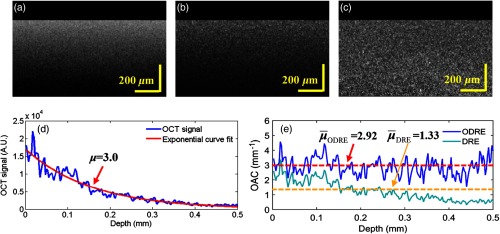
Fig. 7.
(a) OCT intensity image from uniform phantoms; (b) and (c) corresponding OAC image obtained by DRE and ODRE, . (d) A typical OCT A-scan within (a) and the result of exponential curve fitting. The result () is . (e) The blue curve is the estimated result obtained by the ODRE method. The red dotted line is the corresponding average OAC at the depth range of 0.5 mm, which is consistent with the exponential fitting result. The cyan curve is the estimated result obtained by the DRE method; the OAC value is underestimated due to the accumulation of excessive noise during the estimation process. The orange dotted line is the corresponding average OAC, which is significantly smaller than the result of exponential fitting.

