Fig. 7.

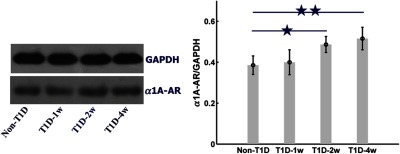
The expression level of at different stages of T1D assessed by western blot. ★ and ★★ compared with non-T1D ( for each group, mean ± standard error).

The expression level of at different stages of T1D assessed by western blot. ★ and ★★ compared with non-T1D ( for each group, mean ± standard error).