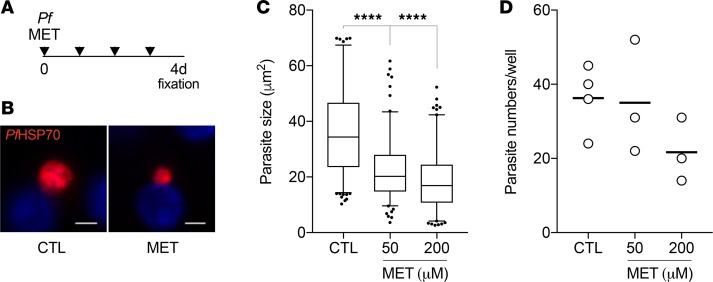
Figure 2. Metformin treatment reduces P. falciparum development in human hepatocytes.
(A) Timeline of metformin treatment, infection, and sample collection. Primary human hepatocytes were infected with 60,000 P. falciparum sporozoites. Prophylactic dosing of metformin (50 and 200 μM) started at 3 hours after infection and repeated daily. Cultures were fixed at day 4 after infection. (B) Representative immunofluorescence images of P. falciparum parasites stained with anti-PfHSP70 antibodies (shown in red) for nontreated control and 200 μM metformin treatment. Nuclei were stained with Hoechst (shown in blue). Scale bar: 5 μm. (C and D) Quantification of P. falciparum size distribution (C) and density (D) at day 4 after infection. The total number of parasites analyzed in 2 independent experiments is 190, CTL; 143, MET 50 μM; 140, MET 200 μM. The outliers in the box plots represent 5% of data points. The box plots depict the minimum and maximum values (whiskers), the upper and lower quartiles, and the median. The length of the box represents the interquartile range. The dots in the scatter plot represent 1 well, and the horizontal bars show the mean, in 1 of the 2 experiments. Ordinary 1-way ANOVA test, ****P < 0.0001.

