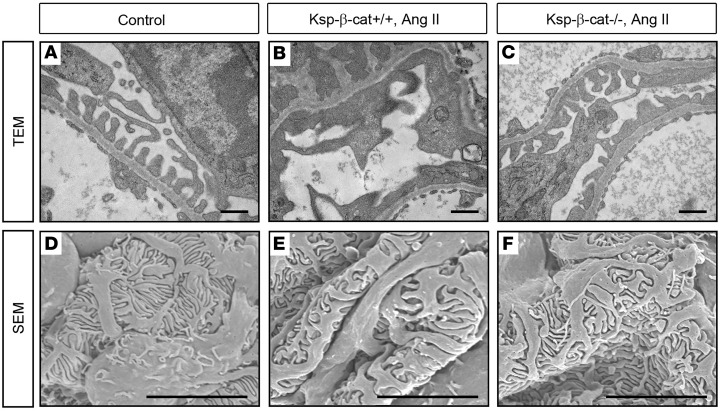
Figure 2. Podocyte foot process integrity is preserved in Ksp-β-cat–/– mice after Ang II infusion.
Mice were treated as in Figure 1. (A–C) Transmission electron microscopy (TEM) showing extensive foot process effacement (arrows) in Ang II–treated Ksp-β-cat+/+ mice compared with Ksp-β-cat–/– mice. Scale bar: 500 nm. (D–F) Scanning electron microscopy (SEM) revealed marked effacement in the control mice compared with untreated control and Ang II–treated Ksp-β-cat–/– mice. Scale bar: 5 μm.

