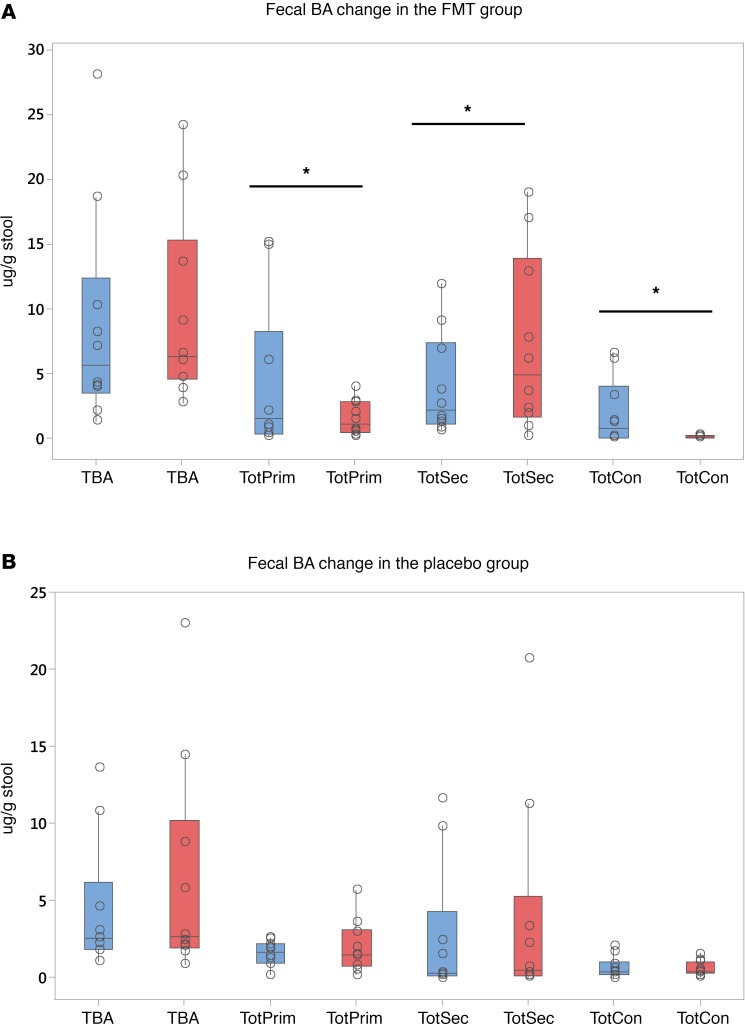
Figure 2. Bile acid concentrations.
Data are presented as median and 95% CI and individual values. Within group comparisons were performed using Wilcoxon matched-pairs test, while Mann Whitney was used for between group analyses. Blue columns represent baseline values, while red columns represent 4-week postintervention values. (A) There was a significant reduction in conjugated and primary bile acids (BAs) and an increase in secondary BAs after FMT compared with baseline. (B) No significant change in these moieties was seen in the placebo group. *P < 0.05 on Wilcoxon matched-pairs test as appropriate. Data are presented as μ/g of dried stool.

