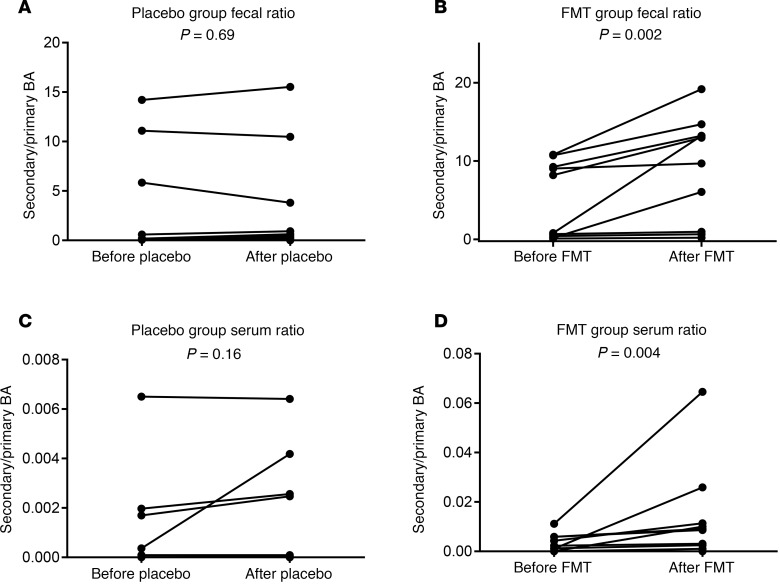
Figure 3. Secondary/primary bile acid ratios.
(A and B) Stool secondary/primary BA ratio. Individual values showing similar values in placebo (A) and increase in all but 3 in FMT (B). (C and D) Serum secondary/primary BA ratio. Individual values showing similar values in placebo (C) and increase in all but 3 in FMT (D). All comparisons were done using Wilcoxon matched-pairs test as appropriate and P values of comparisons are shown.

