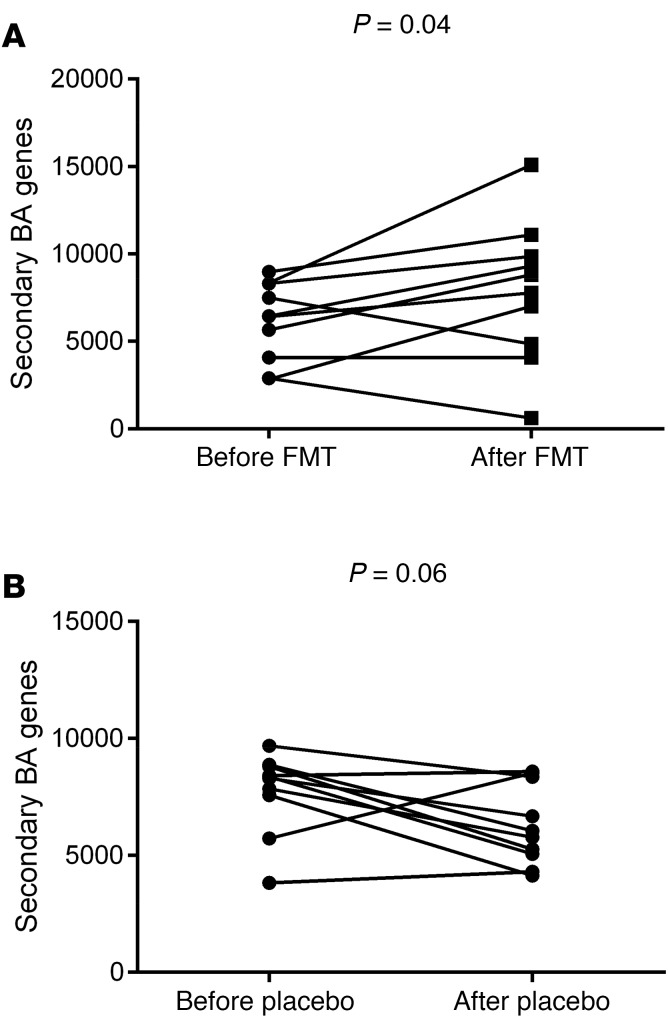
Figure 4. PiCRUST changes in the secondary bile acid synthesis genes before versus after intervention.
(A) Individual values of secondary bile acid synthesis genes before versus after FMT show a significant increase, with 3 patients’ values either similar or lower. These were the same as those whose serum and fecal values were low after FMT. (B) Individual values of secondary bile acid synthesis genes before versus after placebo show a trend toward decrease over baseline.

