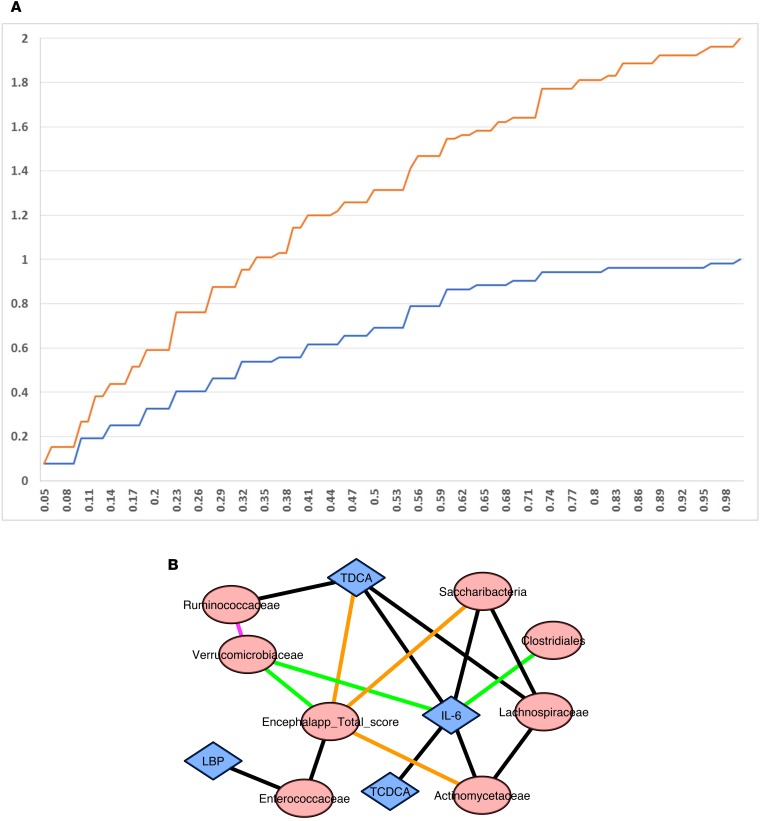
Figure 5. Correlation networks and difference.
(A) Cumulative distribution frequency after FMT was higher than that before FMT in the correlation networks. (B) Pre- versus post-FMT correlation network differences showed changes centered around EncephalApp and serum IL-6. Purple line: positive after FMT: none at baseline; green lines: negative after FMT; none at baseline; black lines: positive at baseline; none after FMT; orange lines: negative at baseline; none after FMT.

