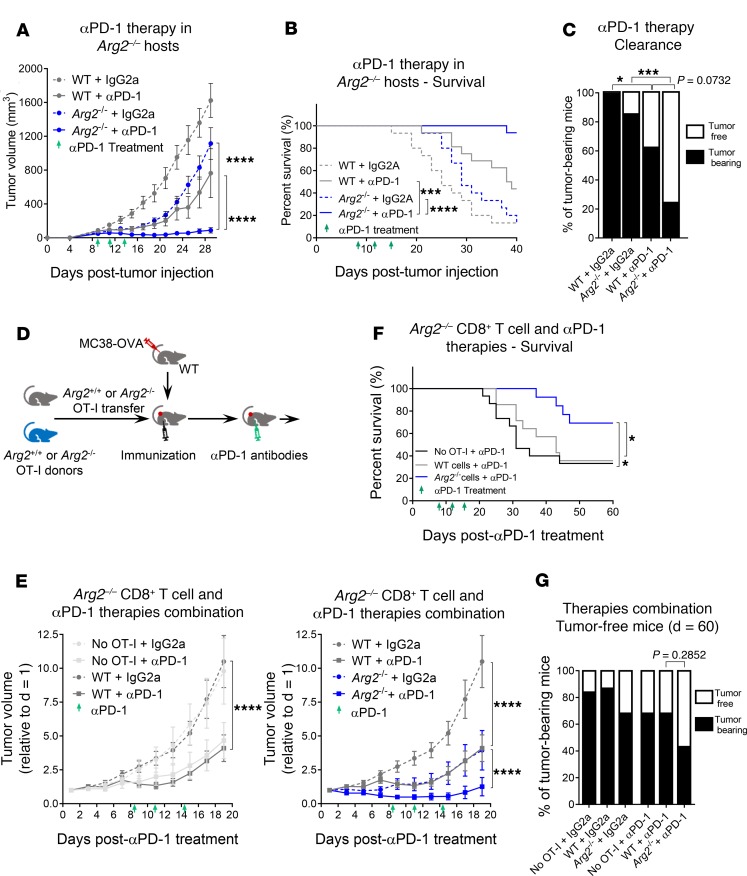
Figure 8. Tumor growth is inhibited synergistically by PD-1 blockade and either germline or CD8+ T cell–intrinsic deletion of Arg2.
(A–C) MC38-OVA cells were implanted s.c. into WT or Arg2–/– hosts, which were then treated with 200 μg i.p. injections of isotype control (IgG2a) or anti–PD-1 antibodies after 8, 11, and 14 days (green arrows). The results show (A) tumor growth, (B) mouse survival, and (C) tumor clearance rates at day 40 after tumor injection (n = 14–16). (D) The scheme illustrates the experimental setting used in panels E and F. WT mice were implanted with MC38-OVA cells; when tumors were palpable (after 5 days), WT or Arg2–/– OT-I cells were adoptively transferred, and mice were immunized the following day with OVA257–264 and CpG-B. Finally, the mice were treated with 200 μg i.p. injections of isotype control (IgG2a) or anti–PD-1 antibodies at days 8, 11, and 14 after T cell transfer (green arrows). Mice receiving no OT-I cells were used as controls. The results show (E) tumor growth, (F) mouse survival, and (G) tumor clearance rates at day 60 after tumor injection (n = 14–16). Isotype control data not shown in F, and in E, data were split into 2 graphs for clarity. (A–F) Results were pooled from 2 independent experiments. (A and E) Statistical analysis was performed using 2-way ANOVA. (A and E) Data is represented as mean ± SEM. *P < 0.05, ***P < 0.001, and ****P < 0.0001 (A and E: 2-way ANOVA) (B and F: log-rank Mantel-Cox test) (C and G: Fisher’s exact test).

