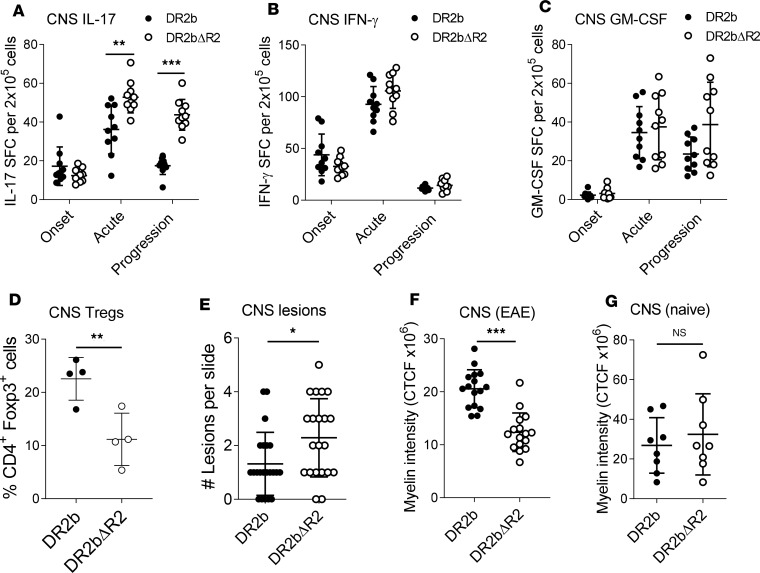
Figure 3. TNFR2 attenuates Th17 cell responses in the CNS of DR2b mice and decreases CNS pathology.
(A–C) Frequencies of MOG35-55–specific (A) IL-17–, (B) IFN-γ–, and (C) GM-CSF–producing T cells in CNS tissue of DR2b and DR2bΔR2 mice immunized for EAE at onset, acute, and disease progression phases measured by cytokine ELISPOT assay. (D) Frequencies of CD4+ Foxp3+ cells in CNS tissue at acute disease in DR2b and DR2bΔR2 mice measured by flow cytometry. (E) Number of lesions per CNS tissue slide from cerebellum and spinal cord sections at acute disease. (F and G) Myelin fluorescence intensity measured by immunofluorescence (IF) microscopy in the cerebellum of (F) EAE mice at the progression phase and in (G) naive animals. CTCF, corrected total cell fluorescence. Representative data from 5 (A–C) or 3 (D) independent experiments with n = 5–10 mice (A–C) or n = 3–5 mice (D) per group. (E and F) Pooled data from 3 independent experiments with n = 4–6 mice per group. (G) Pooled data from 2 independent experiments with n = 8 mice per group. Statistical significance was determined by Student’s 2-tailed t test with Welch’s correction (A–D, F, and G) or Mann-Whitney U test (U = 142.5) (E). *P ≤ 0.05, **P ≤ 0.01, and ***P ≤ 0.001. Error bars indicate mean ± SD.

