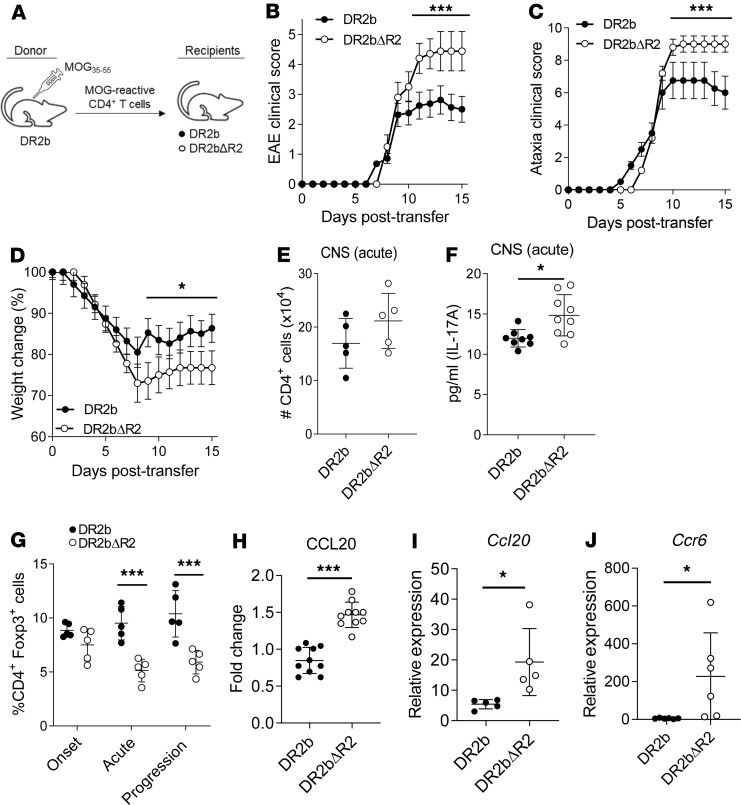
Figure 4. Development of progressive EAE and increased expression of CCL20 in DR2bΔR2 recipient mice.
(A) Schematic showing passive EAE induction of DR2b and DR2bΔR2 mice (recipients) by transferring MOG35-55–reactive T cells obtained from DR2b donors and expanded in vitro. (B) Clinical signs of EAE, (C) clinical signs of ataxia, and (D) change in weight were monitored daily in DR2b and DR2bΔR2 recipient mice after induction of adoptive transfer EAE with DR2b WT T cells. Representative data from 6 (B and C) and 3 (D) independent experiments with n = 4–8 mice per group. (E) CD4+ T cell numbers in CNS at acute disease stage. Representative data from 3 independent experiments with n = 3–5 mice per group. (F) Concentration of IL-17 in whole CNS tissue homogenate at acute disease. Pooled data from 3 independent experiments, n = 8 for DR2b and n = 9 for DR2bΔR2 recipient mice. (G) Frequencies of CD4+Foxp3+ T cells in CNS at onset (day 7 after transfer), acute (day 12 after transfer), and disease progression phase (day 15 after transfer). Representative data from 3 independent experiments with n = 3–5 mice per group. (H) Fold change of CCL20 in whole CNS tissue homogenate at days 12–15 after transfer (acute to progression phase) relative to the experimental mean expression. Pooled data of 3 independent experiments. n = 10 mice per group. (I) Ccl20 mRNA expression in CNS tissue homogenate at acute disease measured by real-time PCR (qPCR). Representative data from 3 independent experiments with n = 3–5 per group. (J) Ccr6 mRNA expression in CNS tissue homogenate at the progression phase measured by qPCR. Pooled data from 2 independent experiments with n = 6 per group. Statistical significance was determined by 2-way ANOVA and for multiple comparisons with Holm-Šídák correction (B–D) or Student’s 2-tailed t test with Welch’s correction (E–J). *P ≤ 0.05; and ***P ≤ 0.001. Error bars indicate mean ± SD.

