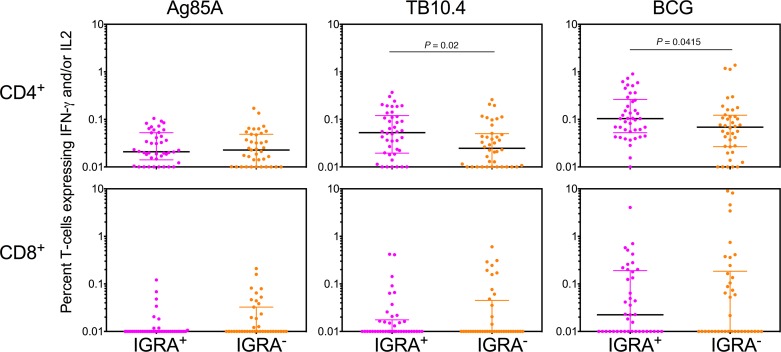
Figure 2. Baseline Mtb antigen–specific T cell responses in whole blood of IGRA+ versus IGRA– subjects.
Scatter plots of Ag85A, TB10.4, and BCG reactive IFN-γ– and/or IL-2–expressing CD4+ (upper panels) and CD8+ (lower panels) T cells in whole blood are shown after background subtraction at baseline in IGRA+ versus IGRA– subjects. Number of subjects in each group range from 38–42. Significant differences between groups were determined using the Mann–Whitney U test (P < 0.05 shown).

