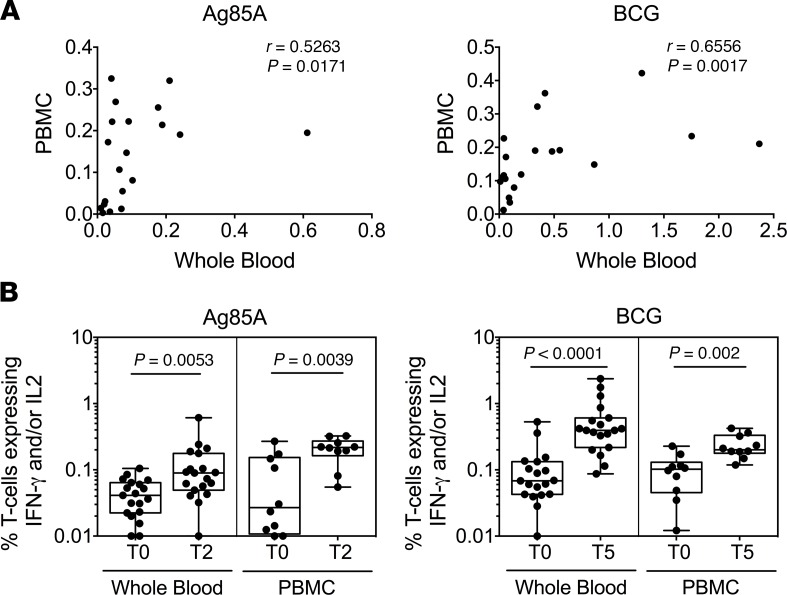
Figure 5. Comparative analysis of whole blood and PBMC ICS assay reveals similar pattern of increase in CD4+ T cell responses after BCG revaccination.
(A) IFN-γ and/or IL-2 frequencies in response to Ag85A (T2) and BCG (T5) stimulation were compared in matched whole blood and PBMC samples from IGRA+ Group 1 subjects. Spearman’s correlation coefficient (r) and significance values (P) are indicated. (B) Box-and-whisker plots show changes in IFN-γ and/or IL-2 frequencies of CD4+ T cells over time in BCG-revaccinated IGRA+ (Group 1) in response to in vitro Ag85A (left panel) or BCG (right panel) restimulation in whole blood (n = 19) and PBMC (n = 10). Significant differences before and after vaccination were determined using the Wilcoxon paired, 2-tailed t test. P < 0.05 was considered significant.

