
Figure 5.
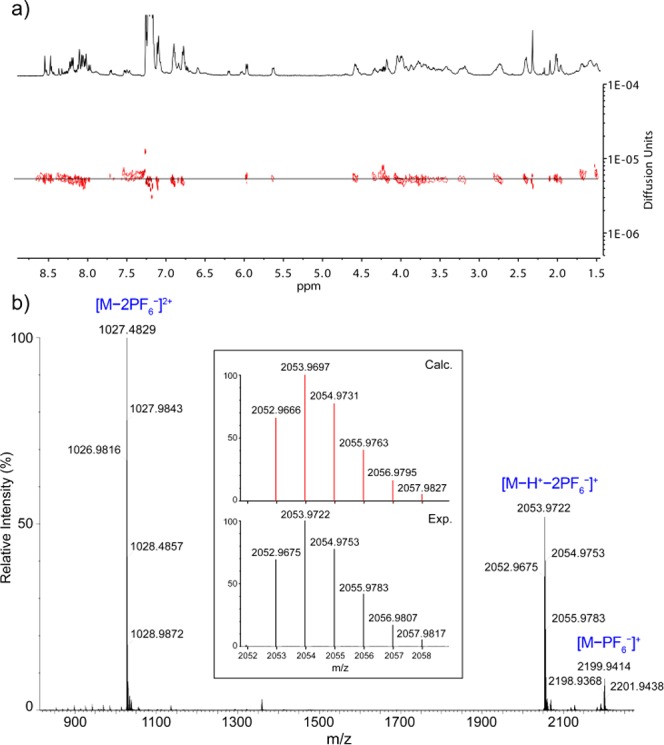
(a) DOSY NMR spectra (500 MHz, CDCl3) of rotaxane 13-H+·PF6–; and (b) HRMS (ESI+-TOF) spectrum of rotaxane 1-H+·2PF6–. Inset: Experimental (bottom) and calculated (top) isotopic distributions for the peak corresponding to the ion [M – H+ – 2PF6–]+.