Figure 6.
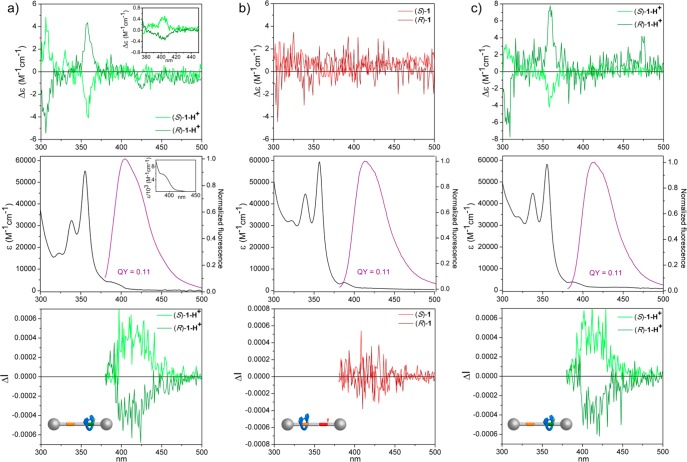
ECD (ca. 1 × 10⁻⁵ M) (top), UV–vis absorption (ca. 1 × 10⁻⁵ M) (black line) and fluorescence (λexc = 355 nm) (ca. 1 × 10⁻⁵ M) (purple line) (middle), and CPL in normalized ΔI scale (λexc = 355 nm) (ca. 1 × 10⁻⁵ M) (bottom) spectra (CHCl3) of (a) 1-H+·2PF6–; (b) 1·PF6–; and (c) 1-H+, obtained by protonation of 1·PF6– with a solution of CF3CO2H in CHCl3. Inset (a): Partial ECD (ca. 1 × 10⁻⁴ M) spectrum showing the lowest energy band (top) and partial UV–vis spectrum (ca. 1 × 10⁻⁴ M) showing the longest wavelength absorption (bottom).

