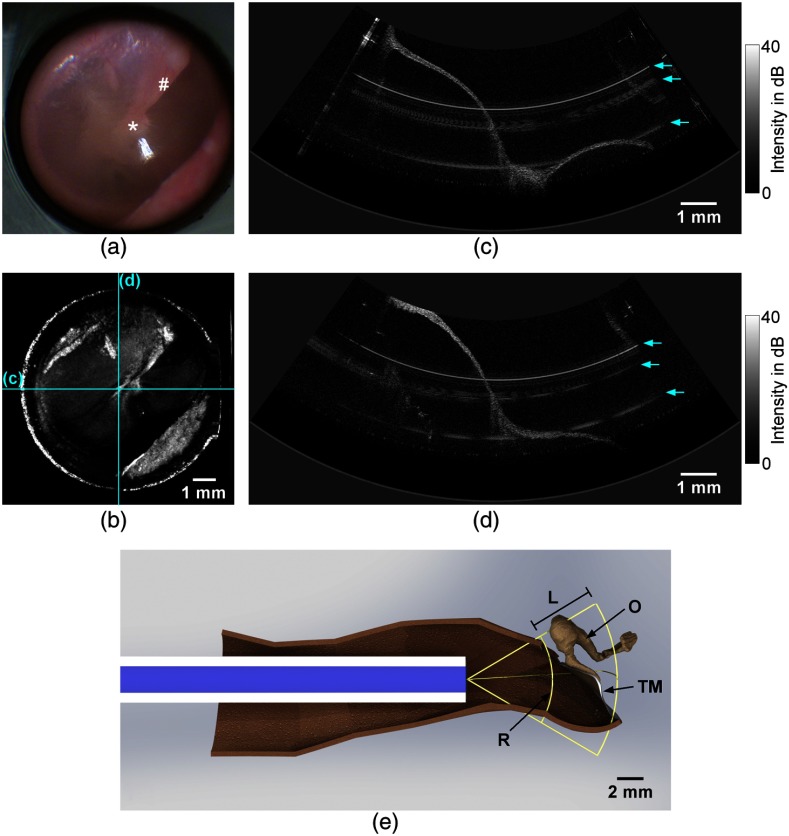
Fig. 4.
The imaging results show the tympanic membrane of a right ear in vivo: (a) video endoscopic image showing the pars tensa with the umbo (*) and the manubrium of malleus (#) and (b) corresponding depth projection of an OCT volume scan. The scale bar in (b) is applicable for the working distance of 8 mm. (c) and (d) Horizontal and vertical central OCT cross sections, corresponding to the fast and slow scan directions. The locations of the cross sections are indicated in the depth projection (b). The arrows in (c) and (d) mark the positions of circular artifacts. (e) Computer-aided design (CAD) model showing the measurement situation with the endoscope being positioned inside an auditory canal: (TM) tympanic membrane, (O) ossicles, (R) reference plane corresponding to the upper border of the OCT image in (d), and (L) OCT image depth range of 5 mm. The OCT image area is spanned by the reference plane R and the image depth range L.

