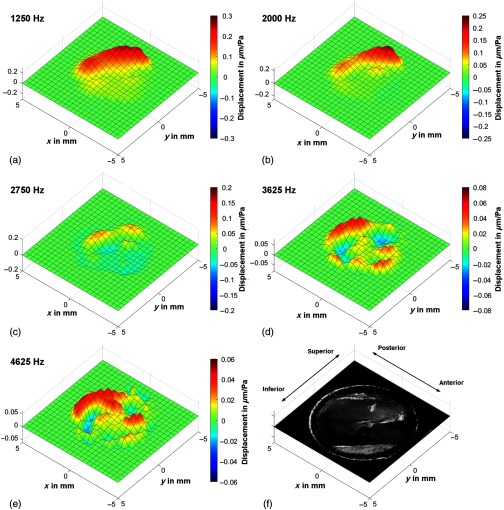
Fig. 5.
(a)–(e) Exemplary oscillation patterns in vivo at characteristic frequencies, which were calculated in postprocessing out of one functional OCT measurement, show the deflection of the tympanic membrane. The displacement scale and color map are adjusted to the maximum amplitude of each oscillation pattern. (f) Depth projection of the corresponding OCT volume scan for comparison. The and scales are applicable for the working distance of 8 mm.

