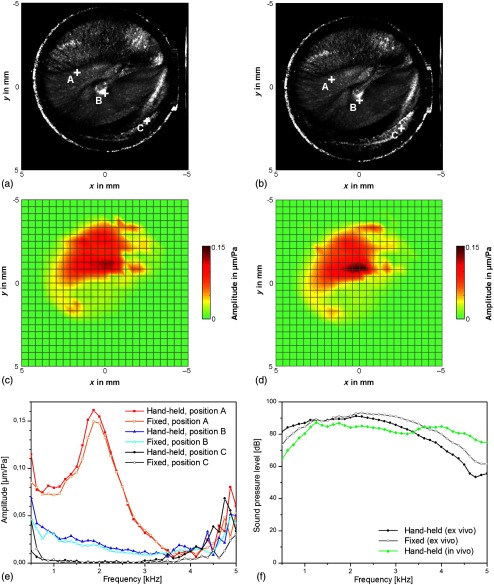
Fig. 6.
Comparison of ex vivo OCT measurements on a human temporal bone specimen with hand-held OCT-scanner (a), (c) and fixed OCT-scanner (b), (d), showing the depth projections of OCT volume scans (a), (b) and the oscillation amplitude at the frequency of 1.500 Hz (c), (d). The and scales are applicable for the working distance of 8 mm. (e) The normalized oscillation amplitude is shown for exemplary points A, B, and C marked in (a) and (b). The points A and B correspond to positions on the pars tensa. In order to demonstrate the detection limit, point C was selected to be outside the tympanic membrane, where no sound-induced oscillation is expected. (f) Sound pressure level for the ex vivo measurements with hand-held and fixed OCT-scanner and for the in vivo measurement presented in Fig. 5.

