Figure 1.
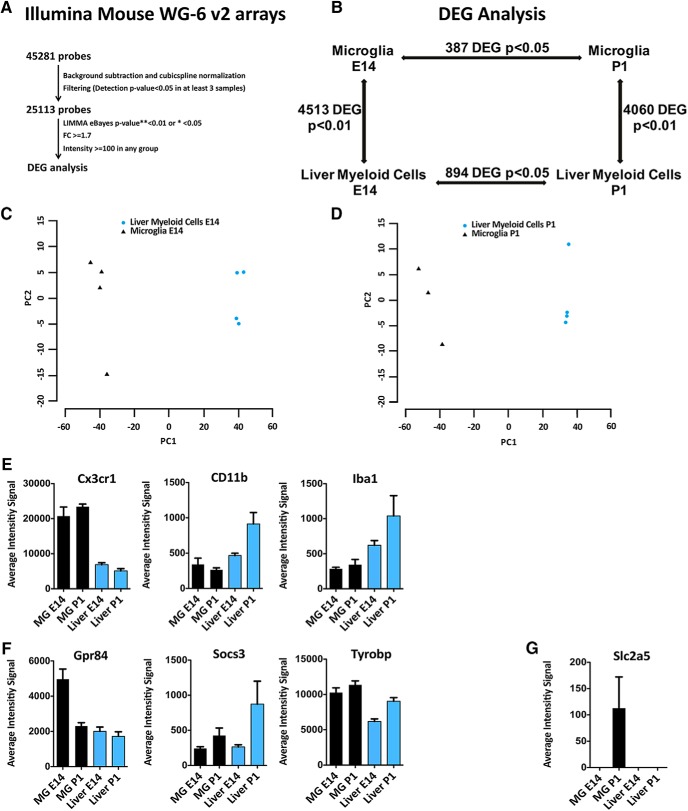
Transcriptional profiling of microglia and liver myeloid cells during development. Genome-wide expression analysis of microglia and liver macrophages sorted from naive C57BL6 E14 embryos and P1 pups. A, Raw data were subjected to background subtraction followed by cubic spline normalization. Filtering was performed for probes with detection p < 0.05 in at least three samples. The significance threshold was set to p < 0.05 for the intra-tissue comparison and p < 0.01 for inter-tissue comparison. Differentially expressed genes (DEGs) were defined by statistical significance and thresholds on fold-change (±1.7) and expression intensity (>100 in any 1 of the 2 compared groups). B, DEGs (4513 and 4060) were found comparing microglia and liver myeloid cells at E14 and P1, respectively, whereas only 387 and 894 DEGs were found between embryonic and postnatal microglia or liver myeloid cells, despite the less stringent statistical threshold (corrected p < 0.05). C, D, PCA plots of microglia versus liver macrophages at E14 (C) and P1 (D). E, Simultaneous expression of pan myeloid genes in microglia and liver myeloid cells at E14 and P1. F, Referred microglial-specific markers were expressed by both microglia and liver myeloid cells at E14 and P1. G, A well known microglia-specific marker (i.e., Slc2a5) was absent in liver myeloid cells at both time points but undetectable in microglia at E14 and barely expressed at P1. Each bar represents the average intensity signal ± SEM of three biological replicates per time point, resulting from a pool of 10 mice each.

