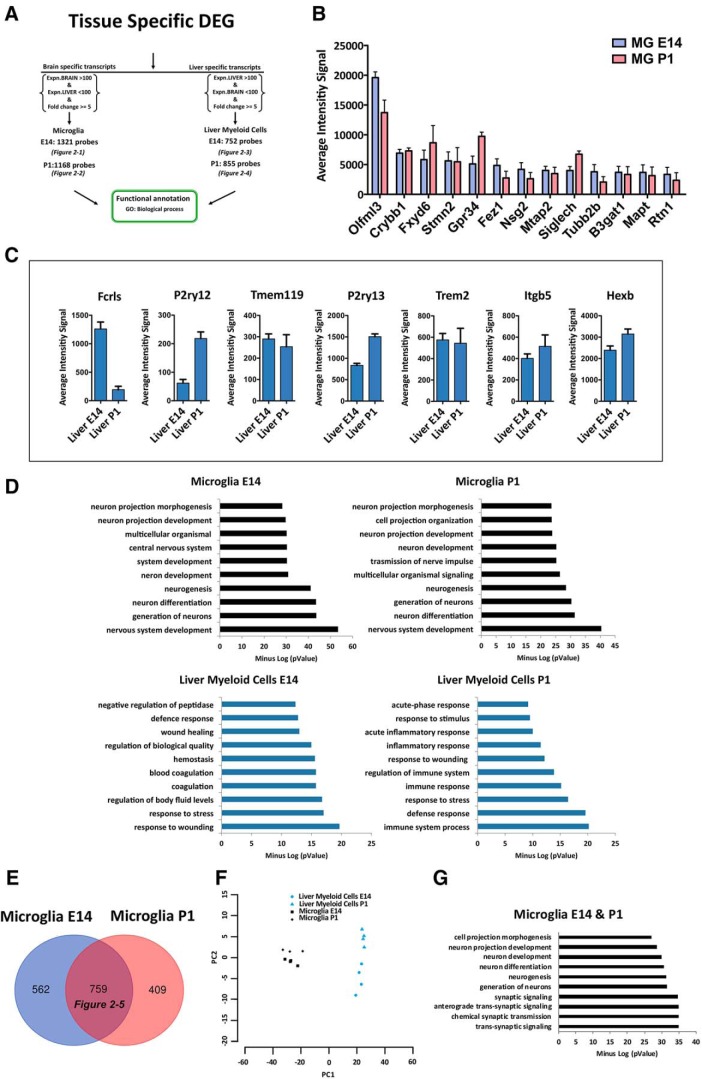
Figure 2.
Identification of microglia-specific transcripts during development. A, Identification of tissue-specific transcripts [1321 E14 microglia (Figure 2-1); 1168 P1 microglia (Figure 2-2); 752 E14 liver myeloid cells (Figure 2-3); and 855 P1 liver myeloid cells (Figure 2-4)] expressed by microglia or liver myeloid cells at each time point with no expression in the other tissue and a fold-change ≥ 5. B, Top expressed transcripts in microglia-specific lists at E14 and P1. C, Well known microglia-specific markers were also detectable in liver myeloid cells and therefore eliminated from further analysis. Each bar represents the average intensity signal ± SEM of three biological replicates per time point, resulting from a pool of 10 mice each. D, Top significant biological processes enriched in each tissue-specific myeloid signature at E14 and P1. E, F, Identification of a core of 759 conserved transcripts, which are microglia-specific during development (Figure 2-5) and relative PCA plot (F). G, Top significant biological processes enriched in microglia-specific lists at E14 and P1.

