Figure 3.
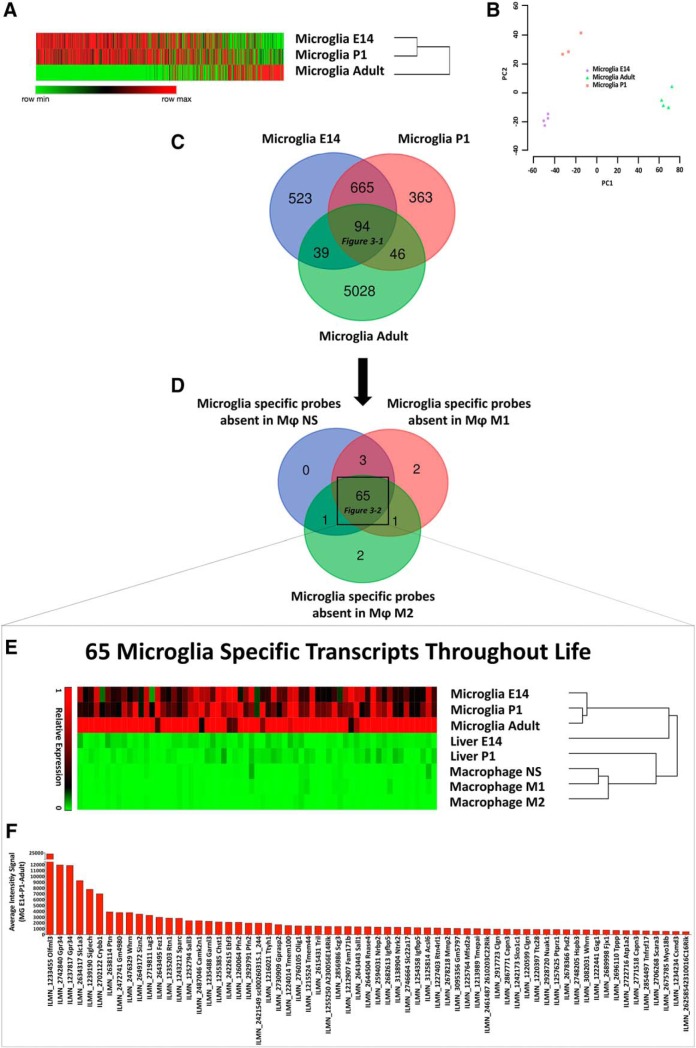
Identification of 65 homeostatic microglia-specific transcripts throughout life. A, B, Heatmap and hierarchical clustering of differentially expressed genes in microglia at E14, P1, and in adulthood. Each lane represents the average expression value of three biological replicates per time-point; relative PCA plot (B). C, Venn diagram displays unique and intersecting DEGs among microglia at E14, P1, and in adulthood. Ninety-four transcripts were shared at all time points (Figure 3-1). D, Venn diagram displaying homeostatic microglia-specific transcripts with no expression in adult peritoneal macrophages at steady state or after differentiation toward an M1 or M2 phenotype. Sixty-five transcripts were absent in all three macrophage populations (Figure 3-2). E, Heatmap and hierarchical clustering of the identified 65 microglia-specific transcripts in microglia at E14, P1, in adulthood, and in liver macrophages at E14 and P1, and peritoneal macrophages at steady state or after differentiation toward an M1 or M2 phenotype. Each lane represents the average expression value of three biological replicates per time point, in turn deriving from polls of 8–10 mice each. F, Average gene expression of the identified 65 microglia-specific transcripts at E14, P1, and adult phase.

