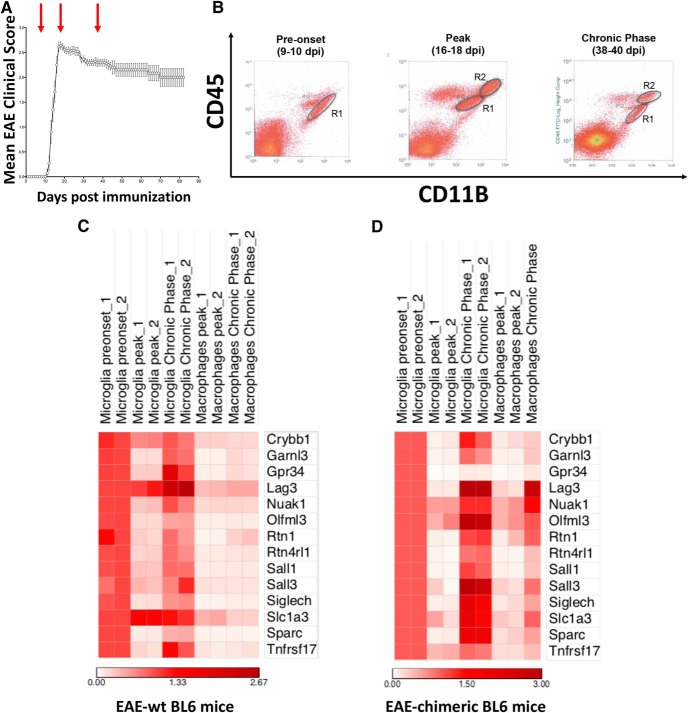
Figure 4.
MoDMs express microglia-specific markers during EAE. A, EAE induction and expression. Red arrows indicate time points used for isolation of CNS myeloid cells (pre-onset, peak, and chronic phase). B, Exemplificative plots of the sorted populations at each time point: R1 (microglia), R2 (MoDMs). C, D, Heatmap reporting mRNA levels of 14 selected microglia-specific genes in sorted microglia and MoDMs during EAE in wild-type mice (C) and chimeric mice (D). Data represent two independent experiments and each sample results from a pool of 10 mice.

