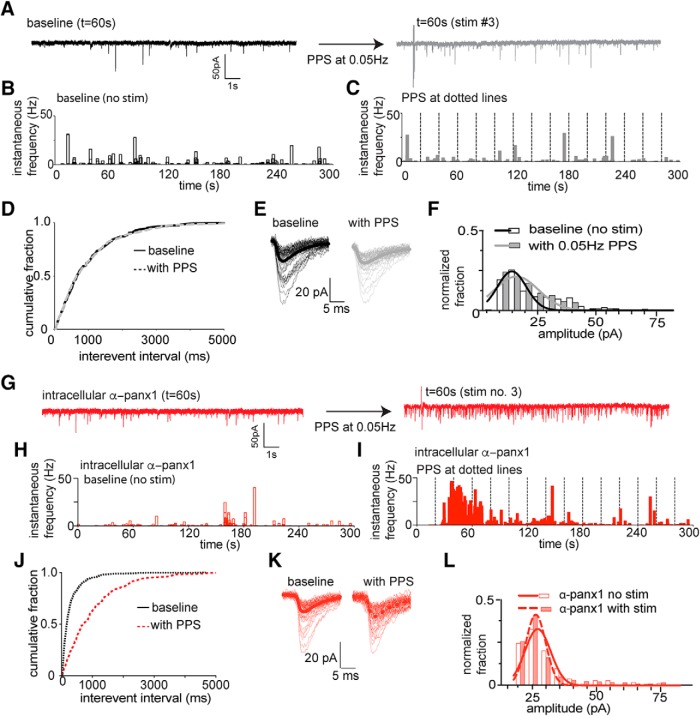
Figure 1.
Block of Panx1 in single postsynaptic neurons enhances facilitated glutamate release during Schaffer collateral stimulation. A, Sample 20 s traces taken from 5 min recordings (as indicated) from the same CA1 pyramidal neuron without Schaffer collateral stimulation (black) and with PPS (gray traces) using a control pipette solution. B, Time (5 min total) versus instantaneous frequency under control conditions for the cell in A. C, Time (5 min total) versus instantaneous frequency during PPS of the Schaffer collaterals (vertical dashed lines) for the cell in A. D, Cumulative distribution of the interevent interval of sEPSC for the population of neurons. Comparisons were made by K-S tests (at p < 0.001). No change in the distribution of interevent intervals was detected after Schaffer collateral stimulation under control conditions. E, Families of sEPSCs from the cell in A and B. Thick dark lines indicate mean sEPSCs. F, Comparison of the distribution of sEPSC amplitudes before and after PPS delivery to the Shaffer collaterals. Amplitude was determined by fit of single Gaussian to the distribution. The population of distributions were compared by K-S tests and were not different for the 29 neurons evaluated. G, Sample 20 s recordings under the condition where 0.25 ng/μl α-panx1 (anti-pannexin-1 blocking antibody) is included in the patch pipette to selectively block postsynaptic Panx1. Traces represent without (left) and with (right) PPS of the Schaffer collaterals taken at the indicated time from the total 5 min experiment. There is an increase in the frequency of sEPSC after PPS of the Schaffer collaterals. H, I, Instantaneous sEPSC frequency versus time plots for the cell in G showing that PPS with α-panx1 in the pipette (right) evoked increases in sEPSC frequency compared with the nonstimulated control (right). J, Comparison of the cumulative sEPSC frequency distribution for the population of neurons. Significance (p < 0.001) was confirmed by K-S test. K, Families of sEPSCs with α-panx1 in the pipette. L, Comparison of the distribution of sEPSC amplitudes before and after PPS delivery to the Shaffer collaterals with α-panx1 in the pipette. Amplitude was determined by fit of single Gaussian to the distribution, and distributions were compared by K-S tests and were not different.

