Figure 8.
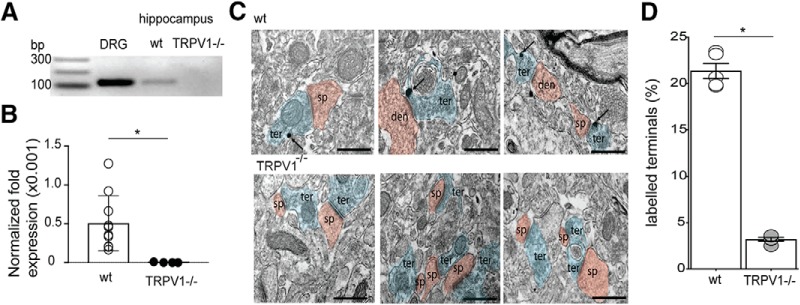
Expression of TRPV1 in the CA1 region is at a portion of presynaptic terminals. A, Demonstration of TRPV1 mRNA by PCR in hippocampus and DRGs. A PCR product is not observed in TRPV1−/− mice. B, Comparison of TRPV1 expression relative to DRG. qPCR levels were first normalized to β-actin levels and then expressed as a fraction of the level in DRG. The hippocampus has a very small, but detectable, amount of TRPV1 mRNA relative to DRG and that TRPV1 mRNA was not detectable in KO mice. C, Sample immuno-EM images of TRPV1 labeling in WT (wt; top) and KO (TRPV1−/−; bottom) mice. Arrows indicate TRPV1 immunogold particles in terminals. Red represents presynaptic terminals. Blue represents CA1 spines. Scale bars, 1 μm. D, Summary of the percentage of labeled terminals in the CA1. B, D, *p < 0.05 (unpaired Student's t test).

