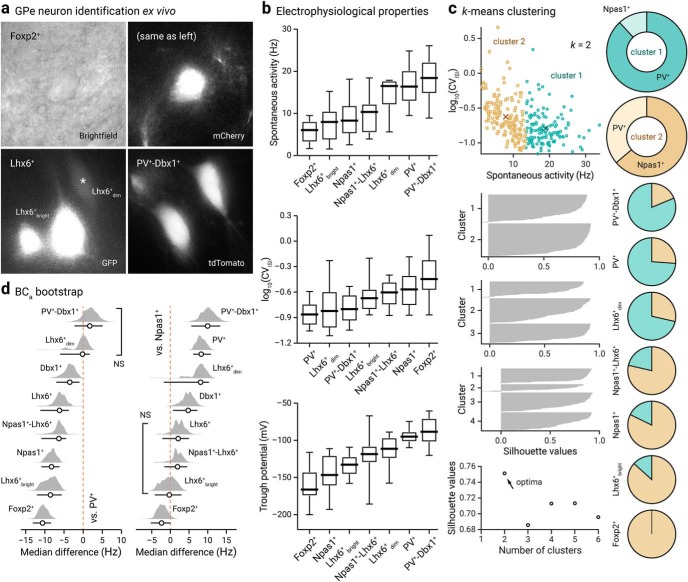
Figure 10.
Genetically identified GPe neurons differ in their spontaneous activity. a, Representative bright-field and epifluorescence images of GPe neuron subtypes in ex vivo brain slices. Foxp2+ neuron (top, bright-field and mCherry), Lhx6+bright neurons and Lhx6+dim (bottom left, GFP), and PV+-Dbx1+ neurons (bottom right, tdTomato) were captured at 60× magnification. Note the difference in the morphology and GFP expression among Lhx6+ neurons. b, Box-plot summary of the electrophysiological properties of identified GPe neuron subtypes. Data are ranked based on the median values. See Tables 5 and 6 for median values, sample sizes, and statistical analysis. Medians, interquartile ranges, and 10th to 90th percentiles are represented in a graphical format. c, Top left, visualization of the clustered data on spontaneous activity (rate and CVISI) for k, 2 clusters. Centroid values for cluster 1 (teal circle) and 2 (tan squares) are as follows: 18.9 Hz, 0.16 and 7.9 Hz, 0.24. Middle left, Silhouette plots for different clusters. Bottom right, Silhouette values are plotted against cluster numbers showing an optima at k, 2. Large positive silhouette values indicate that the data point is close to its cluster's centroid, whereas negative silhouette values indicate that the data point is closer to the centroid of the other cluster. Right, a series of pie charts showing the membership assignment of different genetically defined GPe neuron subtypes. The membership assignment in cluster 1 (teal) and 2 (tan) for each neuron subtypes are as follows: PV+-Dbx1+ (81.3%, 18.8%, n, 16), PV+ (73.9%, 26.1%, n, 111), Lhx6+dim (71.4%, 28.6%, n, 7), Npas1+-Lhx6+ (21.4%, 78.6%, n, 14), Npas1+ (17.7%, 82.3%, n, 62), Lhx6+bright (13.3%, 86.7%, n, 15), Foxp2+ (0.0%, 100.0%, n, 20). Data are not shown for Dbx1+ (50.0%, 50.0%, n, 20) and Lhx6+ (61.1%, 38.9%, n, 18), which both contain a mixture of PV+ neurons and Npas1+ neurons. d, Bias-corrected and accelerated (BCa) bootstrap estimation of effect sizes (median differences) and 95% confidence intervals. The median difference in spontaneous rate for seven comparisons against the PV+ neurons (left) and Npas1+ neurons (right) are shown. Median differences are plotted as bootstrap sampling distributions. Each median difference is depicted as a circle. Median differences are also encoded by color saturation. Lower and upper confidence interval bounds are indicated by the horizontal bars. Lhx6+dim neurons and PV+-Dbx1+ neurons are statistically nonsignificant from PV+ neurons (p, 0.45 and 0.24). Lhx6+bright neurons, Npas1+-Lhx6+ neurons, and Lhx6+ neurons are statistically nonsignificant from Npas1+ neurons (p = 0.44, 0.29, and 0.066).

