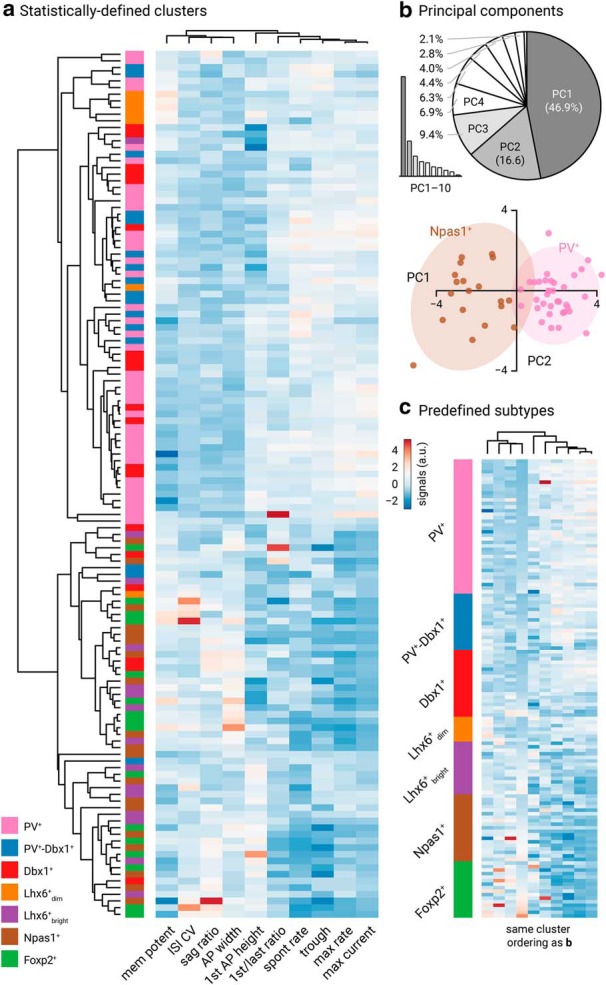
Figure 11.

Electrophysiological multivariate analysis of GPe neurons. a, Heatmap representation of electrical signatures of genetically identified GPe neuron subtypes. Dendrograms show the order and distances of neuron clusters and their electrical characteristics. A total of 130 neurons (n, PV+: 38, Npas1+: 19, Dbx1+: 19, Foxp2+: 16, PV+-Dbx1+: 16, Lhx6+bright: 16, Lhx6+dim: 7) were included in this analysis. Neurons with incomplete data were excluded from the analysis. b, Top, Scree plot (left) and pie chart (right) showing that the first three principal components (gray) capture 72.9% of the total variability in the data. Bottom, Principal component 1 and 2 account for 46.9% and 16.6% of the total variance, respectively. Prediction ellipses for PV+ neurons (pink) and Npas1+ neurons (brown) are shown. With probability 0.95, a new observation from the same group will fall inside the ellipse. c, Same dataset as a. Data are sorted by genetically identified neuron subtypes. Ordering of the clustering is the same as a.
