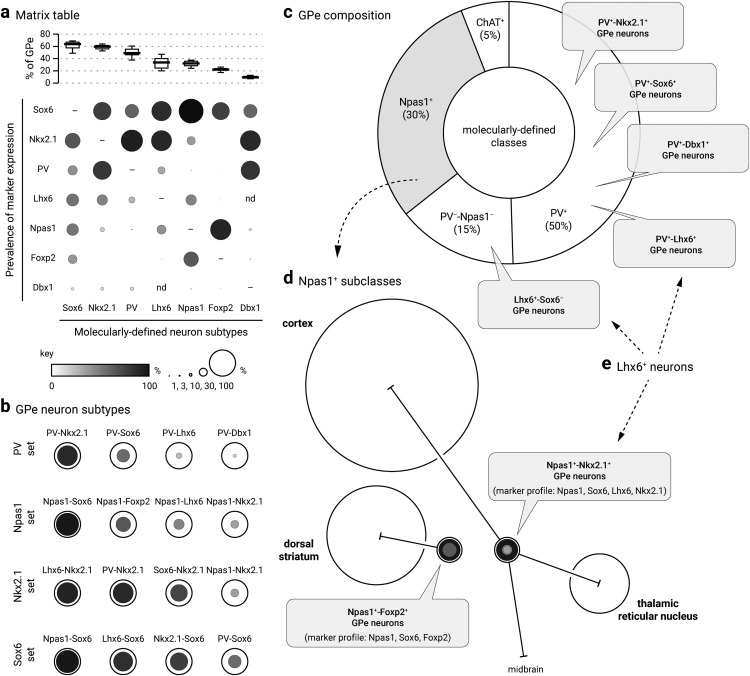
Figure 12.
Diagrams summarizing the marker expression profile and classification scheme derived from the current study. a, Data from Table 3 are graphically represented to convey the coexpression of markers (vertical axis) within each molecularly defined neuron subtype (horizontal axis). As visualized at the top of the matrix table, medians are presented as thick horizontal lines (Fig. 1) and data are sorted according to the abundance of neuron subtypes within the GPe. Both the size and grayscale intensity of each circle represents the prevalence of expression within specific GPe neuron subtypes. Circles along each column do not add up to 100% as there is overlapping marker expression with each neuron subtype. −, Not shown; nd, not determined. For example, Foxp2 (sixth row) is selectively expressed in Npas1 neurons and a subset of Sox6 neurons; it is absent in Nkx2.1+ and PV+ neurons. Within the Foxp2+ population (sixth column), Sox6 and Npas1 are the only markers expressed. The high prevalence of Npas1 and Sox6 within the Foxp2+ neuron subtype (sixth column) is demonstrated by larger and darker circles. Note that because Foxp2 and Nkx2.1 are nonoverlapping, there is no circle for Nkx2.1. Accordingly, Npas1+-Foxp2+ subclass and Npas1+-Nkx2.1+ subclass represent 57% and 32% of the Npas1+ population, respectively. As a comparison, Sox6 (first row) is expressed across all identified neuron types. Sox6 expression (first row) was observed in a major fraction of each population, especially Npas1+ neurons. The Sox6 neuron subtype (first column) expresses a broader range of markers. Last, neurons from the Dbx1 lineage (seventh row) are heterogeneous and overall contribute to only a small fraction of each molecularly defined neuron subtype. b, Summary of the GPe neuron classification based on the expression profile of different molecular markers, i.e., data from a. c, Pie chart summarizing the neuronal composition of the mouse GPe. The area of the sectors represents the approximate size of each neuron class. PV+ neurons (which constitute 50% of the GPe) are heterogeneous. Nkx2.1, Sox6, Lhx6, and Dbx1 are coexpressed in PV+ neurons to a varying extent. How they intersect with each other remains to be determined. Npas1+ neurons (gray) are 30% of the GPe; they can be subdivided into two subclasses (see d). ChAT+ neurons are ∼5% of the total GPe neuron population and show no overlap with other known classes of GPe neurons. d, Two bona fide subclasses of Npas1+ neurons (Npas1+-Foxp2+ and Npas1+-Nkx2.1+) are identified in the mouse GPe. They differ in their molecular marker expression, axonal projections, and electrophysiological properties. Although Npas1+-Foxp2+ neurons project to the dorsal striatum, Npas1+-Nkx2.1+ neurons project to the cortex, thalamus, and mid/hindbrain areas. Size of the target areas (circles) is an artistic rendering based on the volume of those areas, but not the axonal density, synaptic strength, or contacts formed by Npas1+ neuron subclasses. e, Lhx6+ neurons are highlighted. Both PV+-Lhx6+ neurons and Npas1+-Lhx6+ neurons coexpress Sox6. Lhx6+-Sox6− neurons are a subset of PV−-Npas1− neurons.

