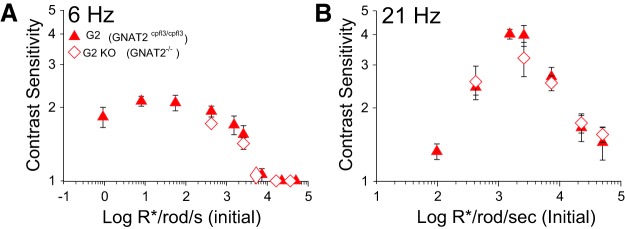
Figure 10.
Similar TCS in G2 and G2 KO mice. A, B, TCS of G2 and G2 KO mice in response to 505 nm stimuli plotted as a function of initial (before bleach) rod photoisomerizations in response to (A) 6 Hz and (B) 21 Hz. TCS of G2 mice is same as in Figure 7 after converting retinal irradiance to photoisomerizations/s in rods. TCS of G2 and G2 KO mice matched closely, suggesting that any residual cone function in G2 mice does not alter their TCS. Symbols represent mean ± SD; n = 3–9 for G2 mice and n = 4 for G2KO mice. Note: data points for G2 KO mice were shifted slightly along the x-axis for clarity.

