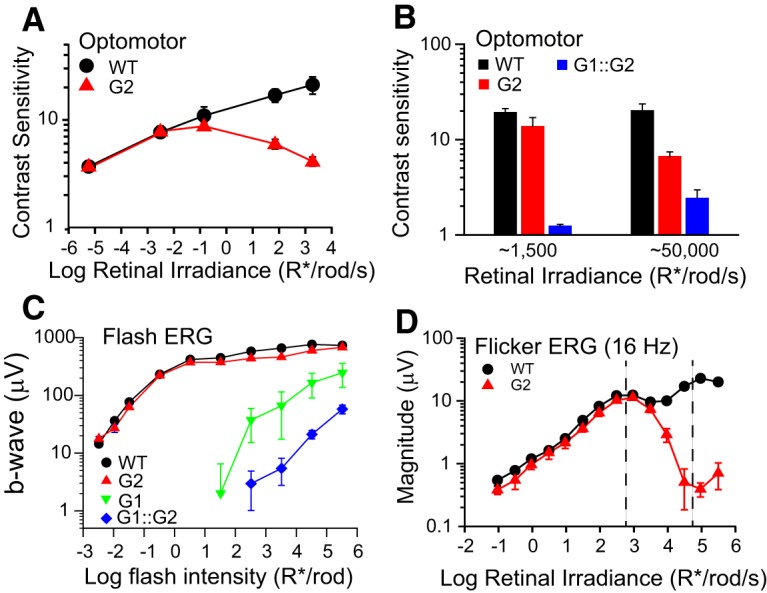
Figure 3.

Desensitized cone responses of G2 mice do not mask rod responses at the mesopic light levels used in this study. A, Optomotor contrast sensitivity of WT (black circles; n = 4) and G2 mice (red triangles; n = 6) plotted as a function of rod photoisomerizations. Grating parameters: ft = 3 Hz, fs = 0.128 cyc/deg. B, Optomotor contrast sensitivity of WT (black bars; n = 5), G2 (red bars; n = 5) and G1::G2 mice (blue bars; n = 6) measured at backgrounds levels of 1500 R*/rod/s and 50,000 R*/rod/s. Grating parameters: ft = 1.5 Hz, fs = 0.128 cyc/deg. C, Amplitudes of dark-adapted flash ERG b-waves as a function of R*/rod for WT (black circles; n = 5), G2 (red triangles; n = 6), G1 (green inverted triangles; n = 5), and G1::G2 mice (blue diamonds; n = 6). D, Magnitudes of the response at the fundamental frequency in the flicker ERG response of WT (black circles; n = 3) and G2 mice (red triangles; n = 3) in response to a 16 Hz sinusoidal stimulus, 100% in contrast and indicated mean retinal irradiance. Region between dashed lines represents the intensity range over which subsequent operant behavior experiments were performed. All mice were 2–4 months old.
