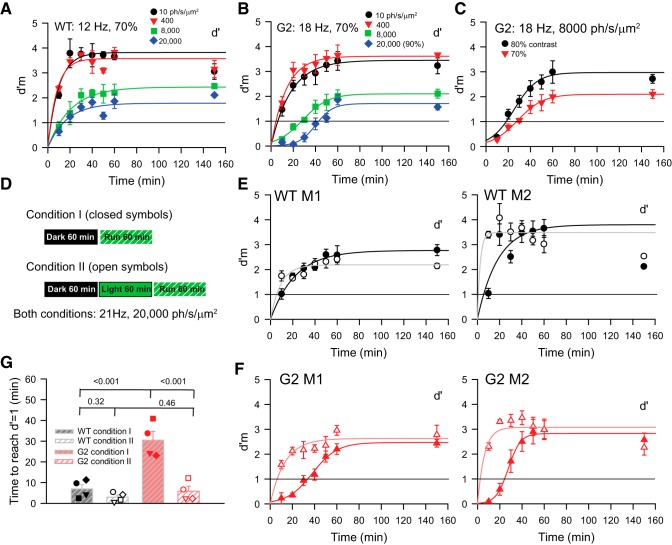
Figure 5.
Rod-driven TCS to high temporal frequencies develops gradually over time. A, B, Values of d′m measured during corrective trials plotted as a function of time after the start of the trial. WT (A) and G2 (B) mice were dark-adapted for 1 h before the trial. Measurements were performed at indicated mean retinal irradiance levels. Flicker contrast was 70% in all cases except for the tests at 20,000 ph/s/μm2, which were performed with 90% contrast flicker. Continuous lines represent fits with rising exponential functions (all curves in A; and response at 10 and 400 ph/s/μm2 in B) and s-shaped hyperbolic functions (B; 8000 and 20,000 ph/s/μm2). Following the initial 60 min of each trial during which the corrective protocol (measured d′m) was run, we switched to the normal protocol (without corrective trials) and determined the average d′ value over the subsequent 90 min. The corresponding value of d′ is indicated at time t = 150 min. Symbols in these plots and in C, E, and F represent mean ± SEM; n = 4–6 runs in each condition. C, The time course of d′m plotted as a function of time for a G2 mouse tested at 8000 ph/s/μm2 and flicker contrasts 80 and 70%. Flicker frequency was 18 Hz. D, Experimental design applied to studies described in E and F. In Condition 1, mice are tested immediately after a 60 min dark-adaptation period (E, F, closed symbols); in Condition 2, mice undergo a 60 min light adaptation period before testing (E, F, open symbols). Retinal irradiance during the light adaptation period was 20,000 ph/s/μm2. Flicker frequency was 21 Hz, and the contrast was adjusted individually to elicit a d′ value ranging from 2 to 2.5. E, F, Values of d′m plotted as a function of time measured with Condition I (closed symbols) and Condition 2 (open symbols). E, d′m values for two representative WT mice (WT M1, WT M2) do not vary with experimental condition; (F) d′m values for G2 mice (G2 M1, G2 M2) rise later in Condition 1 compared with Condition 2. TTR was determined at the intersection of the fitting functions with the line representing d′m = 1 (see G). Fitting functions were rising exponential for all data of (E) and data determined under condition 2 in (F). Hyperbolic functions fit the responses to condition 1 in (F). G, TTR for four WT and four G2 mice measured under Conditions 1 and 2. Analysis: two-way RM ANOVA, Holm–Sidak method; corresponding p values for pairwise comparisons are indicated on graph. See text for details.

