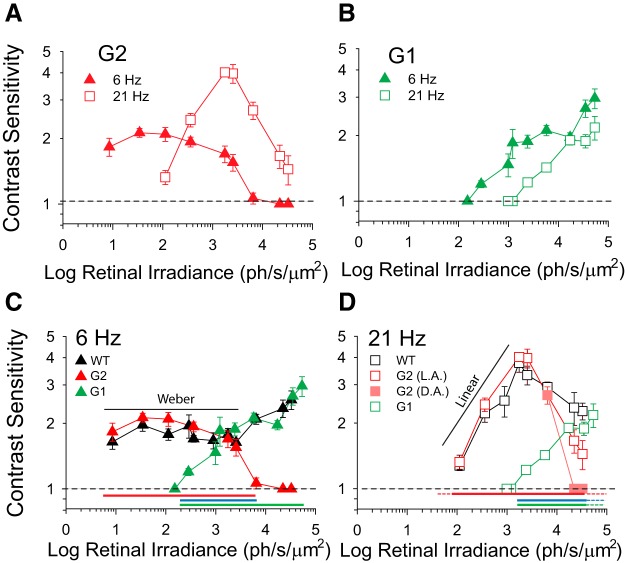
Figure 7.
The mesopic range shifts with temporal frequency. A, B, Contrast sensitivity as a function of retinal irradiance for (A) G2 mice at 6 Hz (filled red triangles; n = 4–9) and 21 Hz (open red squares; n = 3–8); and (B) G1 mice at 6 Hz (filled green triangles; n = 4–5) and 21 Hz (open green squares; n = 3–4). C, D, Contrast sensitivity as a function of retinal irradiance for WT (black; n = 4–11), G2 (red; n = 3–9), and G1 (green; n = 4–5) mice at: (C) 6 Hz and (D) 21 Hz. Sensitivity values in A–D are plotted as a function of the WT retinal irradiance (for WT and G2 mice) or corrected for phenotypic differences in pupil areas (for G1 mice). See Table 1 for respective pupil area and retinal irradiance values. Note: for light conditions where pupil areas were not measured, G1 retinal irradiance values were determined by interpolation of data. Filled pink squares in (D) represent dark-adapted (DA) G2 data and open red squares represent light-adapted (LA) G2 data as described in Figure 5. Red bars represent the intensity range over which rods are active in G2 mice, green bars represent the intensity range over which cones are active in G2 mice, and blue bars represent the mesopic range over which both rods and cones are active. Dashed red, green, and blue lines in (D) represent extrapolated values. Statistics: two-way ANOVA, p values for pairwise comparisons are shown in the figure.

