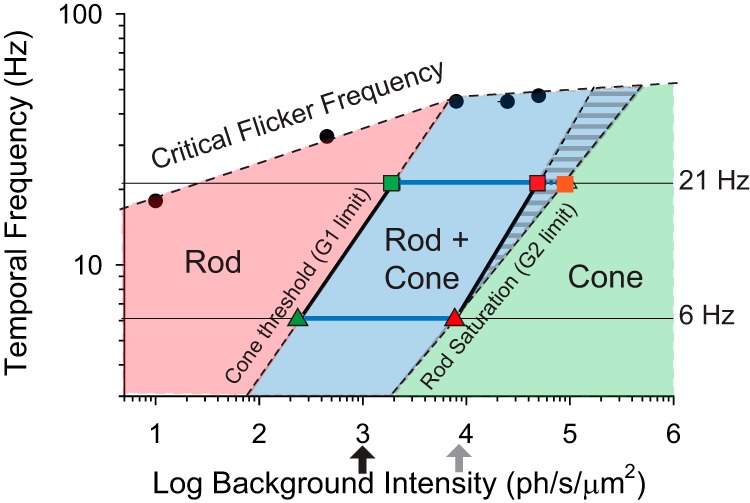
Figure 8.

Map of rod and cone contributions to TCS. Irradiance versus Temporal Frequency adaptation map showing the irradiance-frequency combinations where contrast thresholds are driven largely by rods (pink), cones (green) and rod + cones (blue shading), loosely defining the conditions for scotopic, photopic, and mesopic temporal contrast vision in mouse, respectively. The transition between the pink and blue regions was inferred from the cone threshold values of G1 mice at 6 Hz (green triangle) and 21 Hz (green square), whereas the transition between blue and green regions was defined as the upper irradiance levels eliciting a behavioral response in G2 mice to 6 Hz (red triangle) and 21 Hz (red square) flicker respectively (Fig. 7). The blue region with stripes represents extrapolated sensitivity at high temporal frequencies (Fig. 6). The high-frequency boundary of the map (black circles) is determined by the CFF values for WT mice measured in this study (Fig. 4) and previously by Umino et al. (2018) (see CFF at 10 ph/s/μm2).
