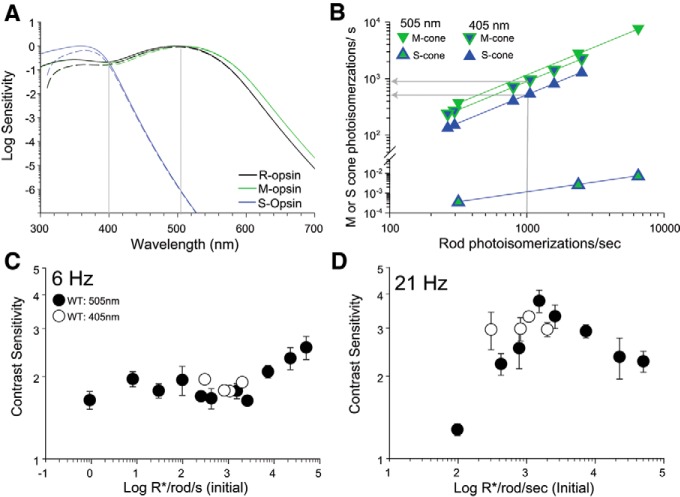
Figure 9.
Activation of S-opsin-expressing cones does not contribute significantly to TCS when coactivated with M-opsin-expressing cones. A, Normalized sensitivity for rhodopsin (R-opsin), M-opsin, and S-opsin plotted as a function of stimulus wavelength. Fits to mouse pigments were computed according to Lucas et al. (2014) using the Govardovskii nomograms (Govardovskii et al., 2000). Sensitivity after accounting for media losses (Jacobs et al., 2004) is shown with dashed lines. B, Estimated photoisomerization rates in pure M-opsin (green edge symbols) or S-opsin (blue edge symbols) -expressing cones plotted as a function of rod photoisomerization rates for 405 nm (filled blue symbols) and 505 nm (filled green symbols) narrowband stimuli (for details of calculations, see Materials and Methods). Photoisomerization rates for cones coexpressing M- and S-opsin at a given wavelength fall within the range delimited by the pure cones (gray arrows; see text for details). C, D, TCS to 405 and 505 nm plotted as a function of initial (before bleach) rod photoisomerization rates for (C) 6 Hz and (D) 21 Hz. TCS to 505 nm is same as in Figure 7 after converting retinal irradiance to photoisomerizations/s in rods. Symbols represent mean ± SD, n = 4–11 mice for 505 nm and n = 4 mice for 405 nm.

