
Figure 5.
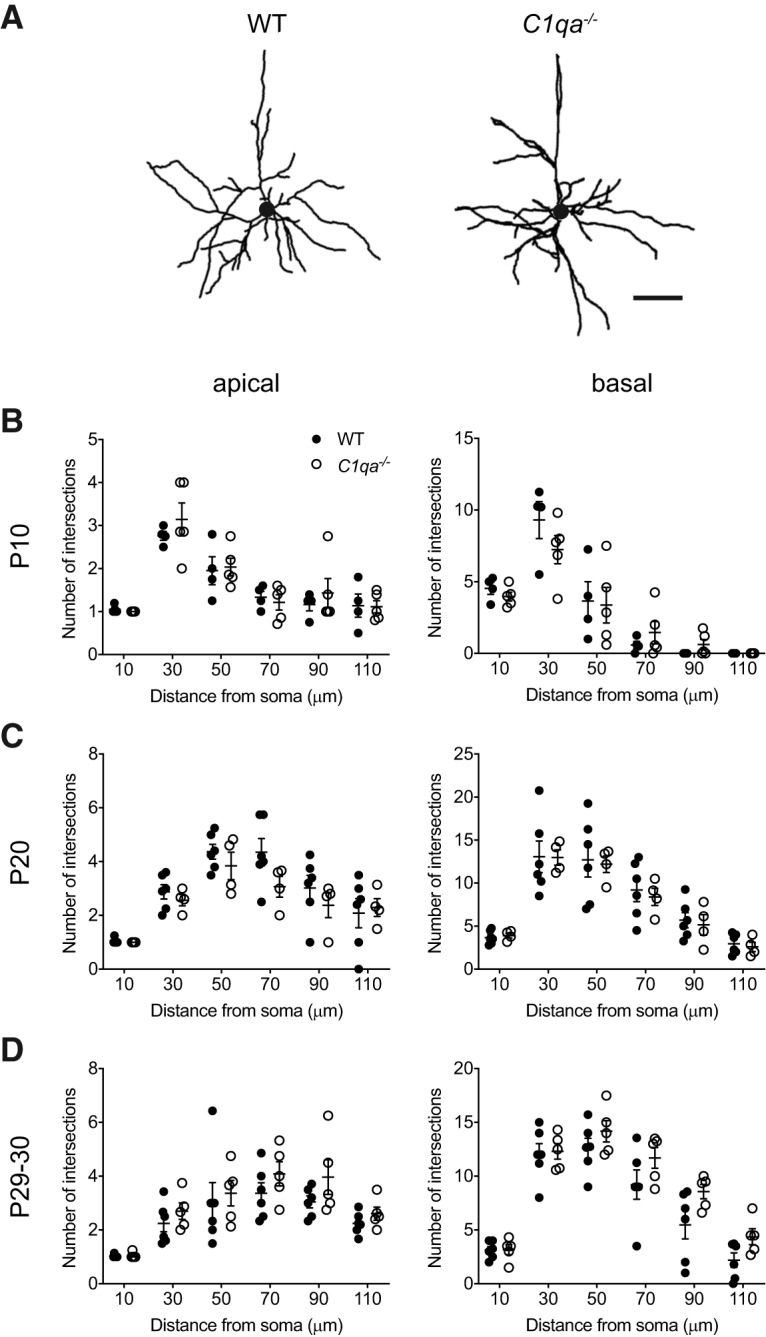
Sholl analysis reveals normal L2/3 pyramidal neuron dendritic arbors in C1qa−/− mice. A, Representative tracings of V1b L2/3 pyramidal neuron dendritic arbors from P29–P30 WT (left) or C1qa−/− (right) mice. Circles in the center of the arbors represent the soma. Scale bar, 50 μm. B–D, Sholl analysis does not find a difference between WT and C1qa−/− V1b L2/3 pyramidal neurons in the number of dendrite intersections at 10, 30, 50, 70, 90, or 110 μm from the soma in either the apical (left) or the basal (right) arbor. This applies at P10 (B), P20 (C), and P29–P30 (D). B, Unpaired two-tailed t test, n = 4–5 mice/genotype. Holm–Sidak's method with α = 0.05 was used to correct for multiple comparisons. Apical: adjusted p = 0.8744 (10 μm), 0.9343 (30 μm), 0.9683 (50 μm), 0.9508 (70 μm), 0.9508 (90 μm), 0.9683 (110 μm); basal: adjusted p = 0.6602 (10 μm), 0.6602 (30 μm), 0.8774 (50 μm), 0.6602 (70 μm), 0.6172 (90 μm), NA (110 μm; all values are 0). C, Unpaired two-tailed t test, n = 4–6 mice/genotype. Holm–Sidak's method with α = 0.05 was used to correct for multiple comparisons. Apical: adjusted p = 0.8869 (10 μm), 0.8869 (30 μm), 0.8869 (50 μm), 0.4866 (70 μm), 0.8869 (90 μm), 0.8869 (110 μm); basal: adjusted p = 0.9969 (10 μm), 0.9969 (30 μm), 0.9969 (50 μm), 0.9969 (70 μm), 0.9969 (90 μm), 0.9969 (110 μm). D, Unpaired two-tailed t test, n = 5–6 mice/genotype. Holm–Sidak's method with α = 0.05 was used to correct for multiple comparisons. Apical: adjusted p = 0.8618 (10 μm), 0.7560 (30 μm), 0.8618 (50 μm), 0.7560 (70 μm), 0.6894 (90 μm), 0.7560 (110 μm); basal: adjusted p = 0.9720 (10 μm), 0.9720 (30 μm), 0.6167 (50 μm), 0.5629 (70 μm), 0.3536 (90 μm), 0.3119 (110 μm). All error bars represent SEM.