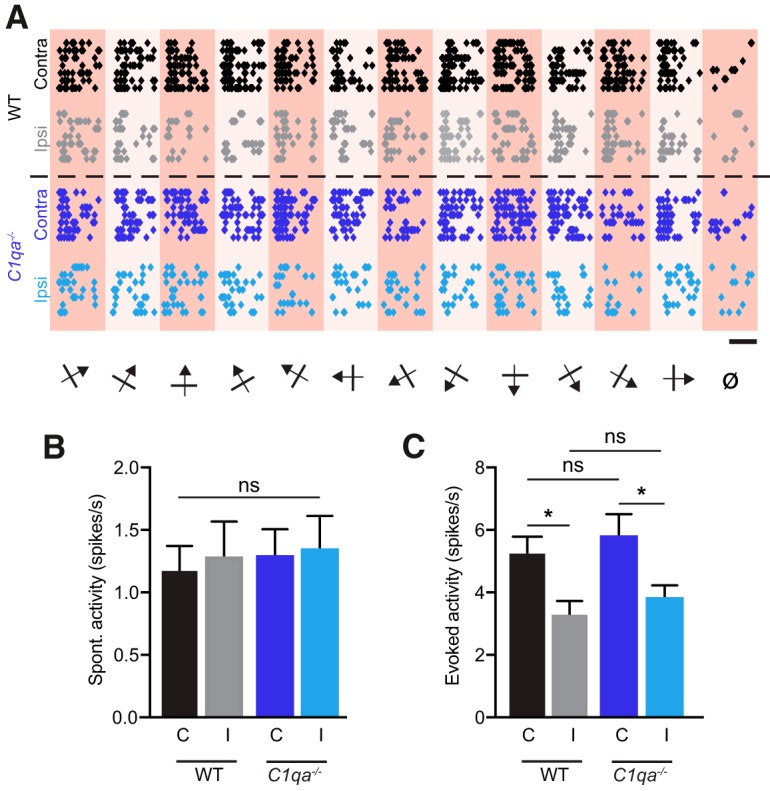
Figure 6.

Firing rates are normal in C1qa−/− mice. A, Raster plots for representative single units from WT and C1qa−/− mice in response to drifting sinusoidal gratings in 12 different directions interleaved by a gray screen (ø) shown to each eye independently. Each circle represents one action potential. Scale bar, 1 s. B, C, Spontaneous (B) and evoked (C) activity of all isolated, visually responsive single units from WT and C1qa−/− mice. Spontaneous firing rates are not different across stimulated eye or genotype (one-way ANOVA, F(3,181) = 0.08636, p = 0.9674, n = 42–50 single units/condition, from 6 animals/genotype). Evoked firing rates are higher when the contralateral eye rather than the ipsilateral eye is stimulated, but are not different between the genotypes (one-way ANOVA, F(3,181) = 4.788, p = 0.0031, n = 42–50 single units/condition, from 6 animals/genotype, WT ipsilateral vs WT contralateral, p = 0.0428, C1qa−/− ipsilateral vs C1qa−/− contralateral, p = 0.0424, WT ipsilateral vs C1qa−/− ipsilateral, p = 0.9413, WT contralateral vs C1qa−/− contralateral, p = 0.9165, Sidak's multiple-comparisons test). All error bars represent SEM. *p < 0.05, ns, not significant.
