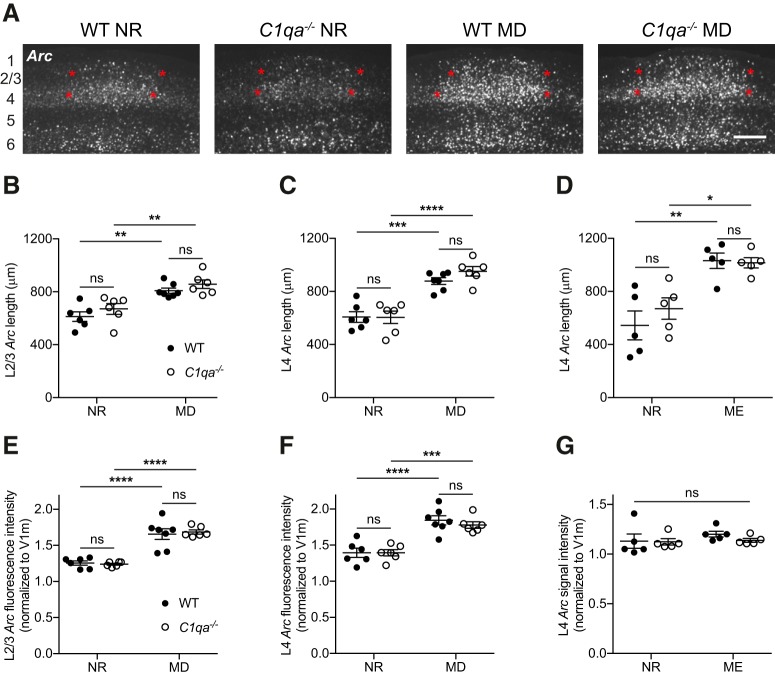
Figure 9.
Binocular zone expansion is normal in critical period C1qa−/− mice. A, Representative images of RNAscope Arc in situ hybridization in V1b of critical period WT or C1qa−/− mice that were either NR or had undergone 4 d of MD. Approximate locations of cortical layers are noted at the far left of the images. Red stars mark the extent of the binocular zone in L2/3 and L4, as measured using the FWHM. Scale bar, 300 μm. B–D, During the critical period, binocular zone expansion as measured by the FWHM of the Arc-positive signal increases in L2/3 following MD (B), in L4 following MD (C), and in L4 following ME (D) compared with NR mice. However, loss of C1qa has no effect on the width of the binocular zone under any of these conditions. B, Two-way ANOVA, F(1,21) = 35.19, p < 0.0001 for MD; F(1,21) = 2.717, p = 0.1142 for genotype; F(1,21) = 0.02172, p = 0.8843 for interaction, n = 6–7 animals/group; WT NR vs C1qa−/− NR, p = 0.6052, WT NR vs WT MD, p = 0.0014, C1qa−/− NR vs C1qa−/− MD, p = 0.0032, WT MD vs C1qa−/− MD, p = 0.7042, Tukey's multiple-comparisons test. C, Two-way ANOVA, F(1,21) = 69.53, p < 0.0001 for MD; F(1,21) = 0.9028, p = 0.3528 for genotype; F(1,21) = 1.029, p = 0.3219 for interaction, n = 6–7 animals/group; WT NR vs C1qa−/− NR, p > 0.9999, WT NR vs WT MD, p = 0.0002, C1qa−/− NR vs C1qa−/− MD, p < 0.0001, WT MD vs C1qa−/− MD, p = 0.5039, Tukey's multiple-comparisons test. D, Two-way ANOVA, F(1,16) = 29.77, p < 0.0001 for ME; F(1,16) = 0.5278, p = 0.4780 for genotype; F(1,16) = 0.8672, p = 0.3656 for interaction, n = 5 animals/group; WT NR vs C1qa−/− NR, p = 0.6521, WT NR vs WT ME, p = 0.0018, C1qa−/− NR vs C1qa−/− ME, p = 0.0258, WT ME vs C1qa−/− ME, p = 0.9989, Tukey's multiple-comparisons test. E–G, During the critical period, binocular zone Arc signal intensity, normalized to the signal intensity in V1m, increases in L2/3 following MD (E), in L4 following MD (F), but not in L4 following ME (G), compared with NR mice. Loss of C1qa has no effect on the Arc signal strength under any of these conditions. The lack of an effect of ME on signal intensity is likely due to the use of colorimetric, rather than RNAscope, in situ hybridization for this experiment. E, Two-way ANOVA, F(1,21) = 82.53, p < 0.0001 for MD, F(1,21) = 0.02663, p = 0.8719 for genotype, and F(1,21) = 0.2541, p = 0.6195 for interaction, n = 6–7 animals/group. WT NR vs C1qa−/− NR, p = 0.9952, WT NR vs WT MD, p < 0.0001, C1qa−/− NR vs C1qa−/− MD, p < 0.0001, WT MD vs C1qa−/− MD, p = 0.9625, Tukey's multiple-comparisons test. F, Two-way ANOVA, F(1,21) = 55.72, p < 0.0001 for MD; F(1,21) = 0.3273, p = 0.5733 for genotype; F(1,21) = 0.3465, p = 0.5624 for interaction, n = 6–7 animals/group; WT NR vs C1qa−/− NR, p > 0.9999, WT NR vs WT MD, p < 0.0001, C1qa−/− NR vs C1qa−/− MD, p = 0.0006, WT MD vs C1qa−/− MD, p = 0.8366, Tukey's multiple-comparisons test. G, Two-way ANOVA, F(1,16) = 0.9614, p = 0.3414 for ME; F(1,16) = 0.6366, p = 0.4366 for genotype; F(1,16) = 0.4253, p = 0.5236 for interaction, n = 5 animals/group; WT NR vs C1qa−/− NR, p = 0.9996, WT NR vs WT ME, p = 0.6626, C1qa−/− NR vs C1qa−/− ME, p = 0.9954, WT ME vs C1qa−/− ME, p = 0.7374, Tukey's multiple-comparisons test. All error bars represent SEM. *p < 0.05, **p < 0.01, ***p < 0.001, ****p < 0.0001, ns, not significant.

