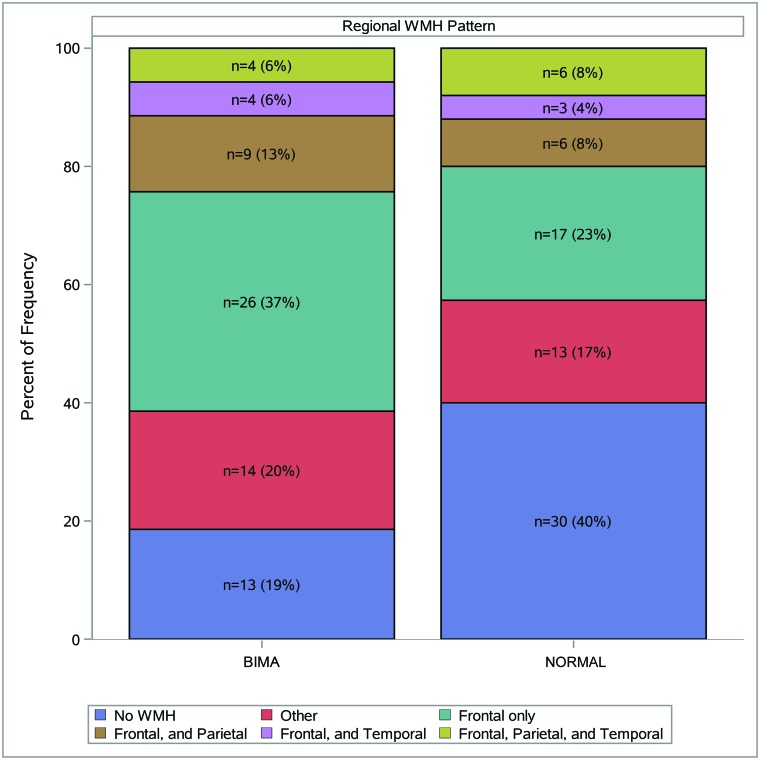
Fig 1.
WMH pattern by study group. Distributions of regional WMH patterns are presented by study population. Patterns are classified by the presence of ≥1 WMH in each region (eg, in BIMA n = 4, 6% of participants were observed to have ≥1 WMH in the frontal, parietal, and temporal regions). The most commonly observed patterns are presented in this figure; less commonly observed patterns are classified as “Other.”

