Figure 1.

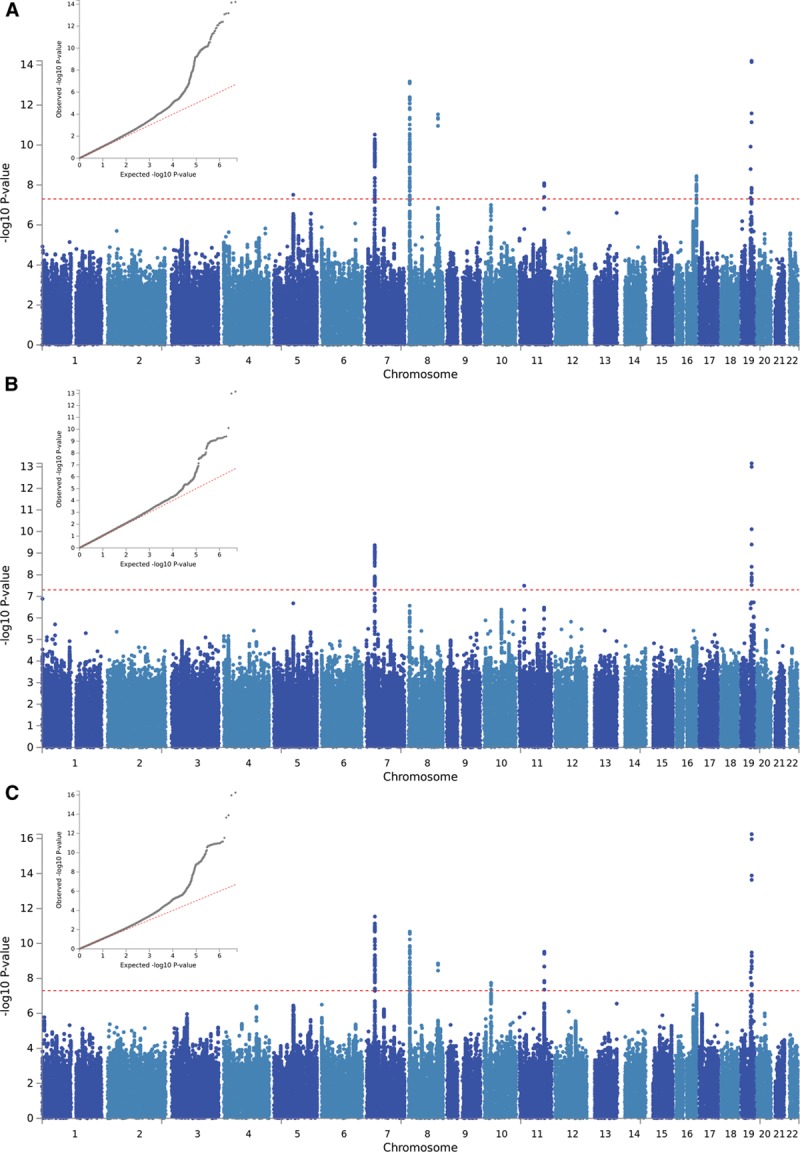
QQ and Manhattan plots of results of the genome-wide association study of (A) average of mean carotid intima-media thickness (cIMT) values (IMTmean), (B) average of maximum cIMT values (IMTmax), and (C) IMTmean-max.

QQ and Manhattan plots of results of the genome-wide association study of (A) average of mean carotid intima-media thickness (cIMT) values (IMTmean), (B) average of maximum cIMT values (IMTmax), and (C) IMTmean-max.