
Figure 2.
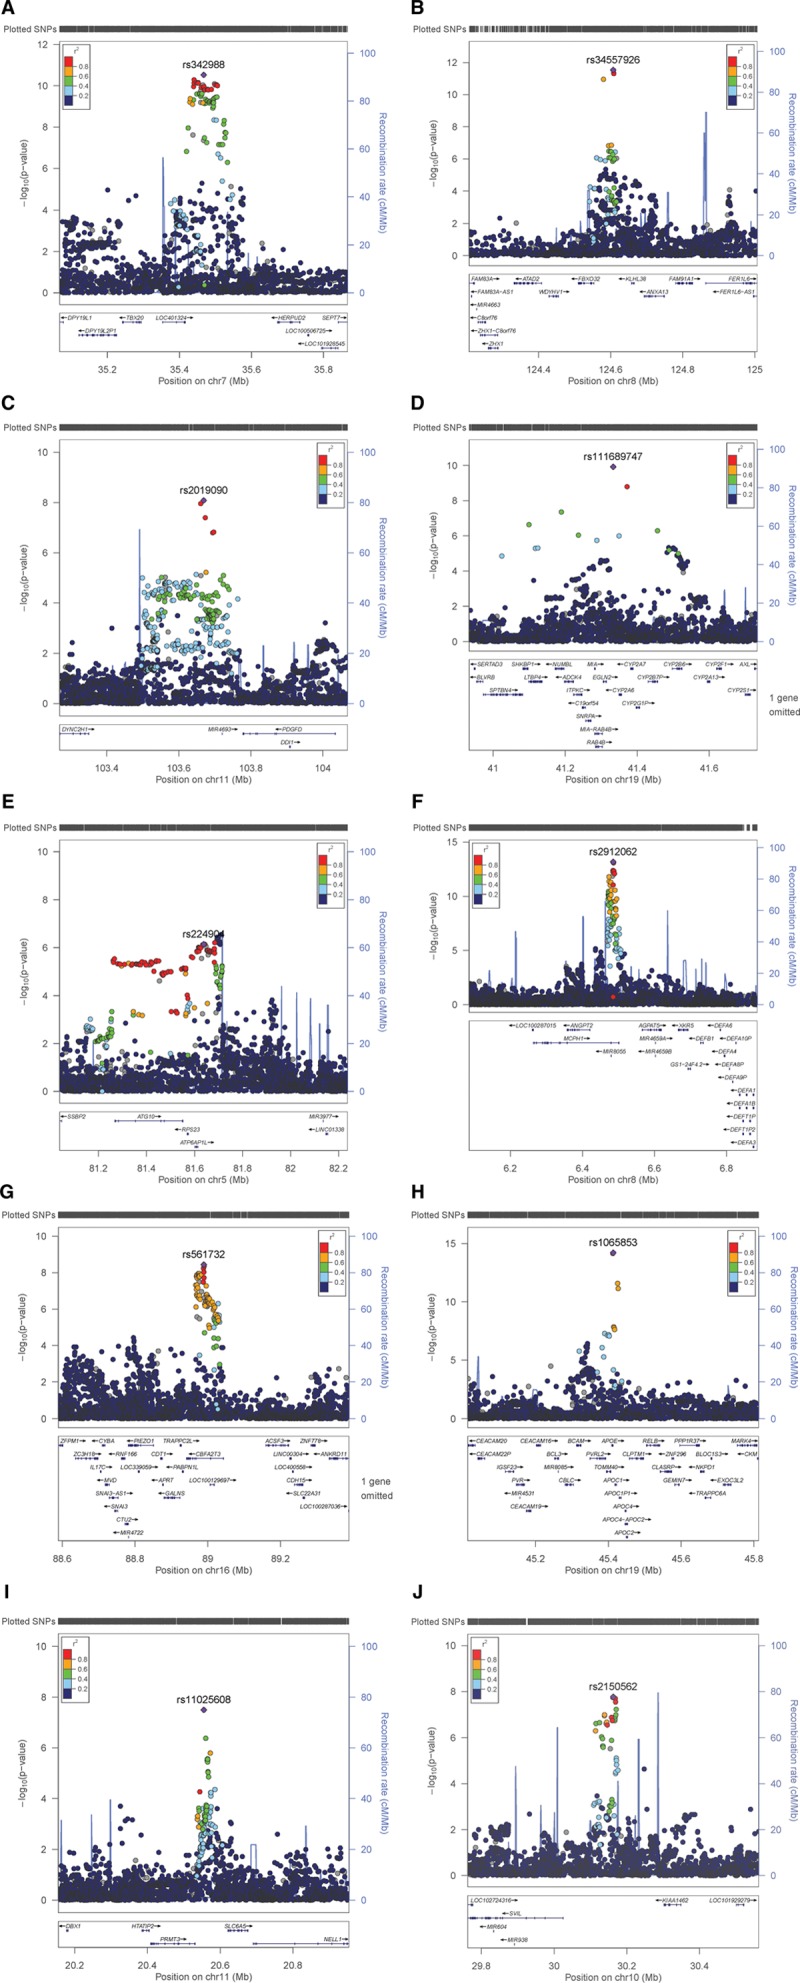
Regional plots for novel average of mean carotid intima-media thickness (cIMT) values (IMTmean)–associated loci on (A) chromosome (Chr) 7 (rs342988), (B) Chr8 (rs34557926), (C) Chr11 (rs2019090), (D) Chr19 (rs111689747) and known IMTmean-associated loci on (E) Chr5 (rs224904, instead of lead SNP rs758080886), (F), Chr8 (rs2912062), (G) Chr16 (rs561732), (H) Chr19 (rs1065853) as well as (I) the novel locus for average of maximum cIMT values on Chr11 (rs11025608). The lead single nucleotide polymorphism (SNP) is indicated by a purple diamond. Linkage disequilibrium (LD; r2) between other SNPs and the lead SNP is indicated by color. Gray indicates LD is not known.