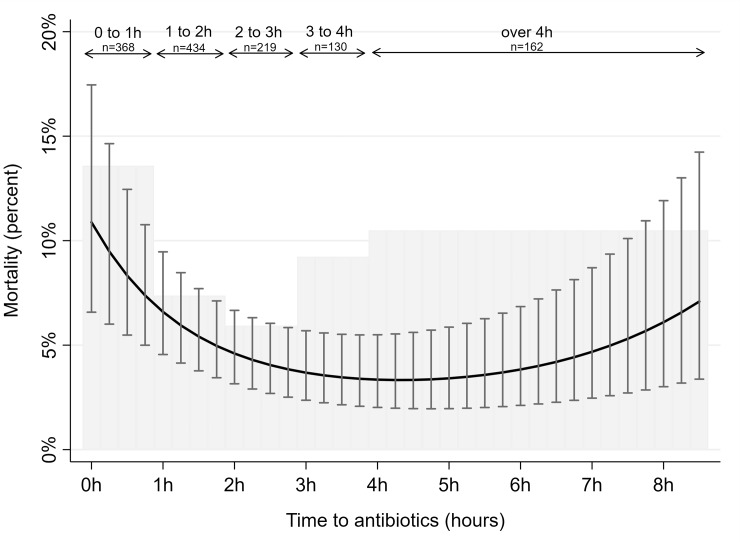
Fig 2. All-cause 30-day mortality by time to antibiotic treatment.
Gray shaded histogram represents mortality rates according to time to antibiotic treatment in hours. Solid black curve with bars represents model-predicted mortality rates with 95% confidence intervals according to time to antibiotic treatment in minutes using logistic regression models, adjusted for patient’s age, date of admission, comorbidity, and presence of organ failure. Date of admission was measured using calendar days since study start, entered as a polynomial function with first (b -0.011 p<0.001), second (b 2.5e-5 p<0.001) and third degree (b -1.2e-8 p<0.01) variables. The model prediction uses average values for adjustment values.

