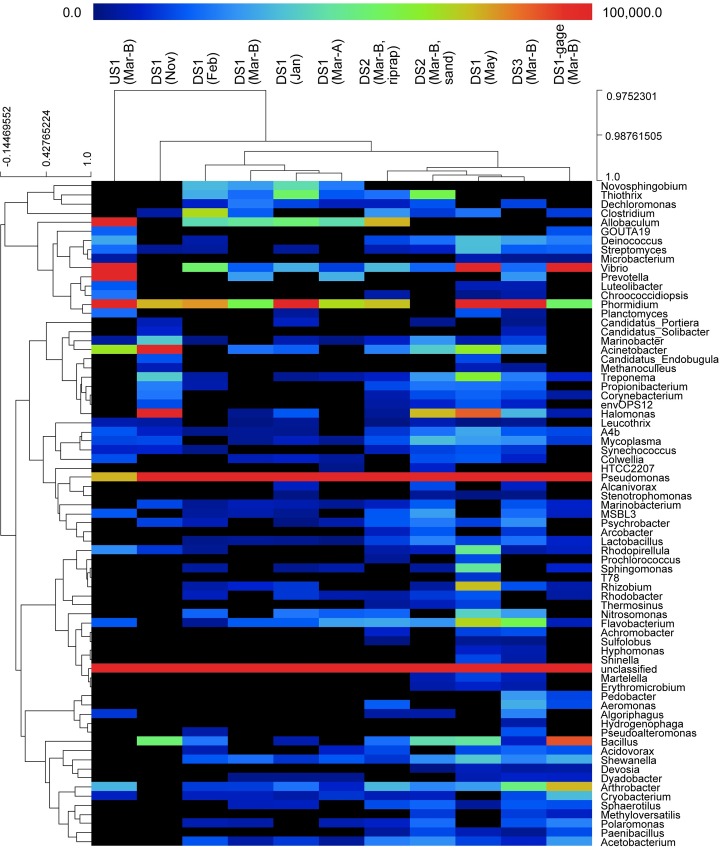
Fig 6. Heatmap showing genus-level biofilm community composition, based on PhyloChip results.
Dendrograms for the subset of samples analyzed with PhyloChip show relative similarity of biofilm communities at the sample level (columns) and similarity of samples at the genus level (rows). Color scale is based on hybridization scores, which reflect organism abundance; black boxes indicate values of zero. Heatmap created in MeV (MultiExperiment Viewer) in the TM4 software suite [46].

