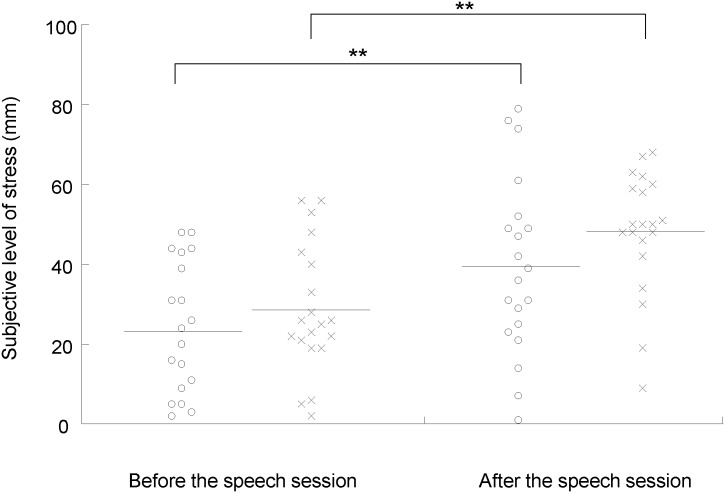
Fig 2. Subjective levels of stress before and after the speech sessions under the stress (open circles) and control (crosses) conditions.
Participants were asked to rate their subjective level of stress on a 100-mm visual analog scale (VAS) from 0 (minimum stress) to 100 (maximum stress). The horizontal line in each plot indicates mean value. **P < 0.01, paired t test with Bonferroni’s correction.

