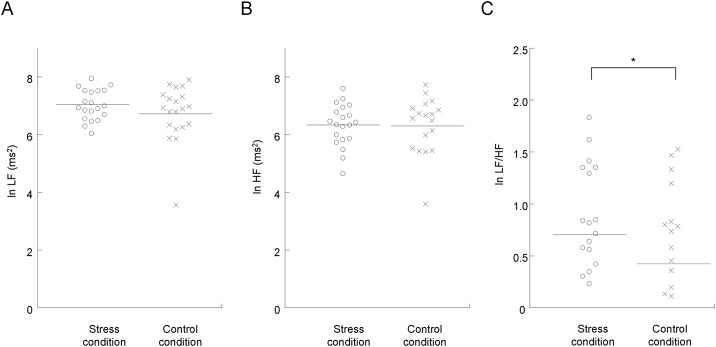
Fig 4. Alterations in autonomic activity as assessed by frequency analysis of R-R wave intervals of electrocardiography during the magnetoencephalography (MEG) session under the stress (open circles) and control (crosses) conditions.
Values were transformed by natural logarithm (ln). Low-frequency power (ln LF; A), high-frequency power (ln HF; B), and the LF/HF ratio (ln LF/HF; C) under the stress and control conditions are shown. The horizontal line in each plot indicates mean value. *P < 0.05, paired t test with Bonferroni’s correction.

