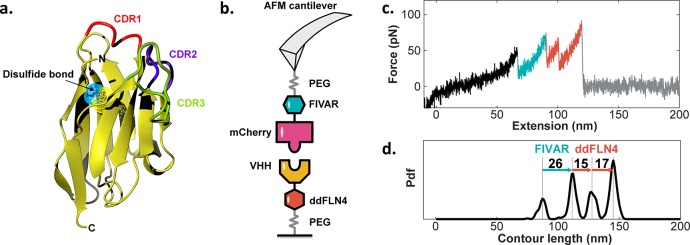
Figure 1.
AFM-SMFS on VHH/mCherry complexes. (a) Homology model of VHH domain. The disulfide bond is shown as surface mesh in blue and yellow. Modeling was carried out using the ABodyBuilder server.58 (b) Measurement setup with mCherry-FIVAR attached to the cantilever and VHH-ddFLN4 attached to the substrate. (c) Typical force versus extension trace showing unfolding of FIVAR (cyan) and ddFLN4 (orange) marker domains, followed by complex rupture. (d) Contour length histogram of the data in panel (c). Increments between peaks were used to make domain assignments to unfolding events.

